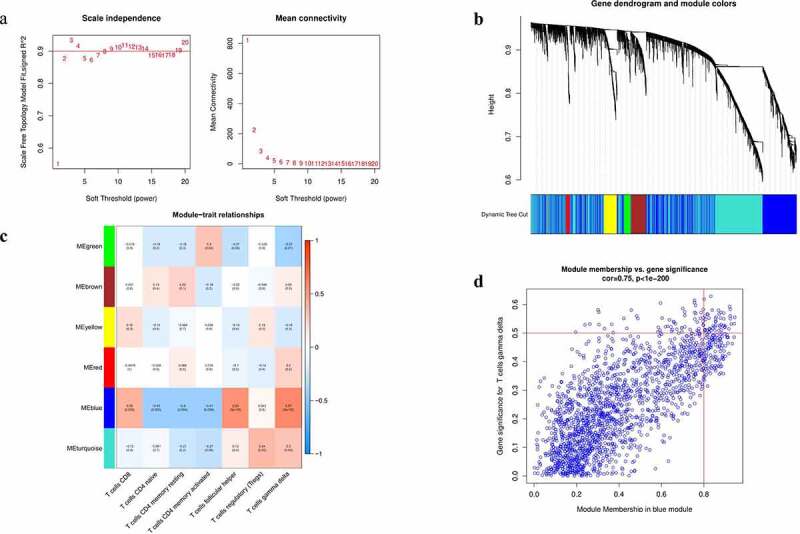
Figure 1.

Construction of WGCNA analysis
Notes: (a) Analysis of connectivity distribution and scale-free topological histogram of different soft threshold power (β). (b) Hierarchical clustering grouped genes into various modules and different colors represent different modules. (c) Heatmap shows correlations of module-related genes and T-cell infiltration. (d) A scatter plot of gene significance (GS) for T cells gamma delta vs. module membership (MM) in the blue module.Abbreviations: WGCNA, weighted gene co-expression network analysis
