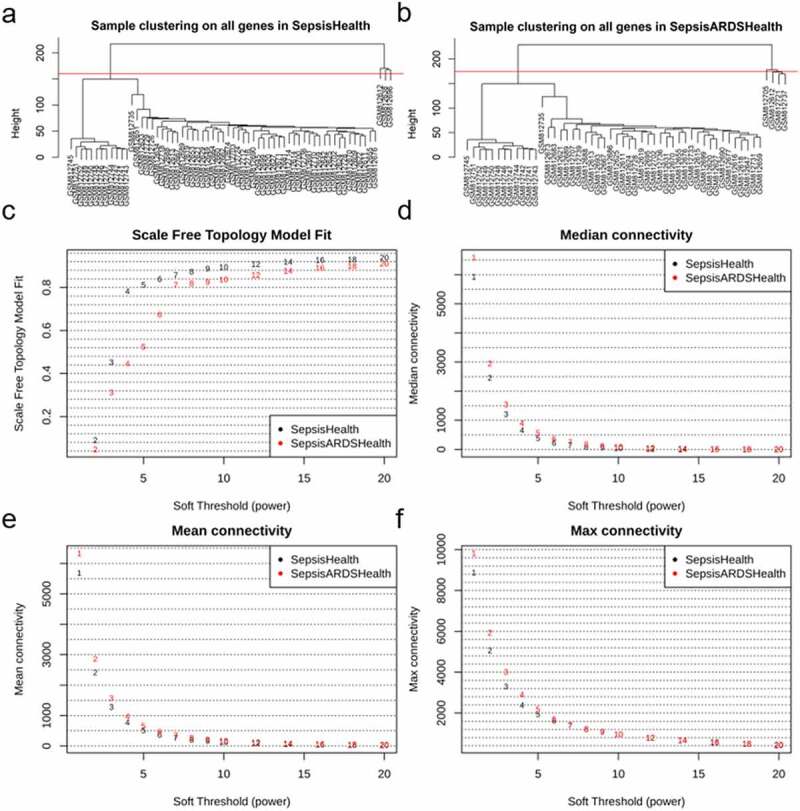
Figure 1.

Identifying outliers and defining soft-thresholding power. (a) and (b) show the hierarchical clustering tree of two samples matrix; the red line indicates the cut position; samples above the red line will be discarded. (c-f) show the decision of power value; c, the scale-free fit index (y-axis) under different power (x-axis); (d) to (f), the median, mean, and max connectivity (y-axis) drops with the increase of the soft-thresholding power (x-axis). the plots indicate that the power of 7 is the suitable value because the connectivity measures decline steeply with the increase of power
