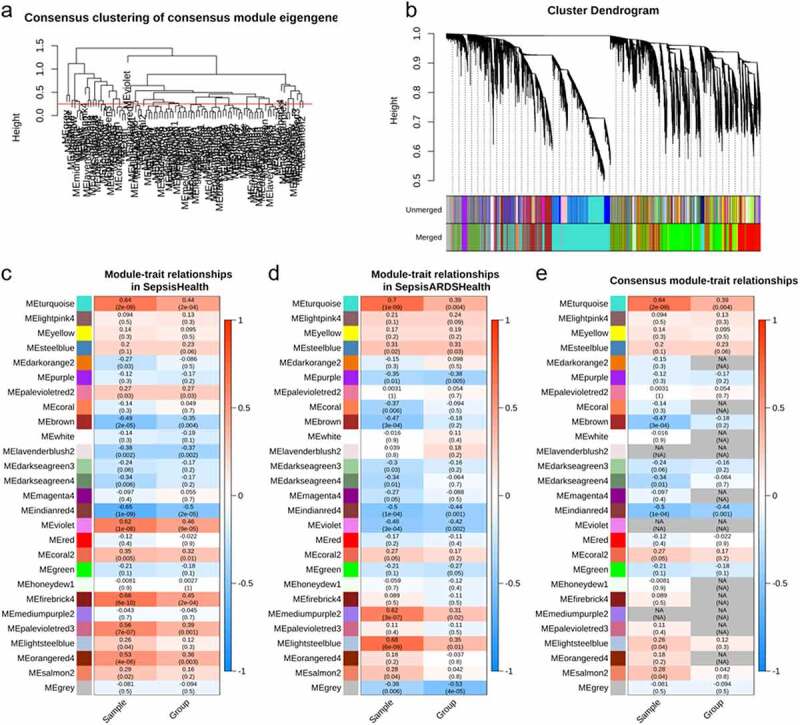
Figure 2.

Network construction of consensus modules. (a) shows the clustering tree of module eigengenes; red line (0.25) represents that the correlation is 0.75 and modules under the line will be merged. (b), the clustering tree of genes (top), primary modules (middle), and merged modules (bottom); (c-e) relationships of consensus module eigengenes and clinical traits in sepsis, sepsis-induced ARDS, and across sepsis and sepsis-induced ARDS (se/ARDS) data. the numbers in the box indicate the correlation (top) and its P-value (bottom) of module eigengenes (rows) and clinical traits (columns). missing (NA) entries represent that the failure of formation of consensus because the correlations in sepsis and se/ARDS are opposite
