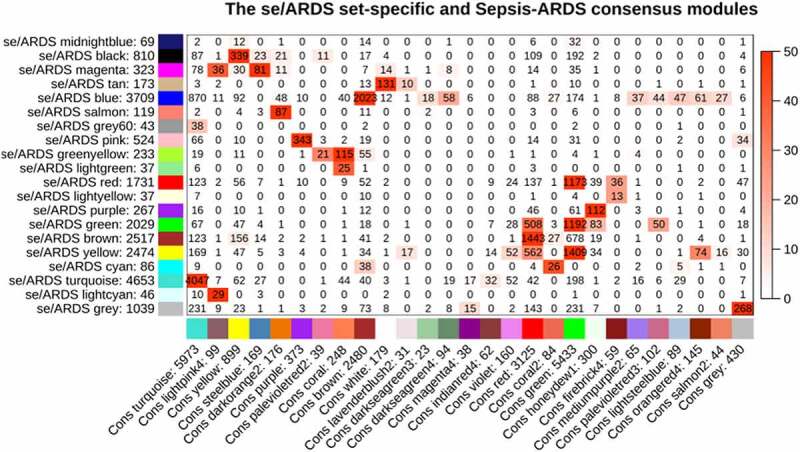
Figure 5.

Correspondence of sepsis-induced (se/ARDS) set-specific and the se/ARDS-sepsis consensus modules. each row of the table refers to one se/ARDS set-specific module, each column to one consensus module. numbers indicate gene counts in the intersection of consensus modules. the significance of overlap is color-coded; the stronger the red color, the more significant the overlap is. the table represents that most se/ARDS set-specific modules are observed in consensus modules
