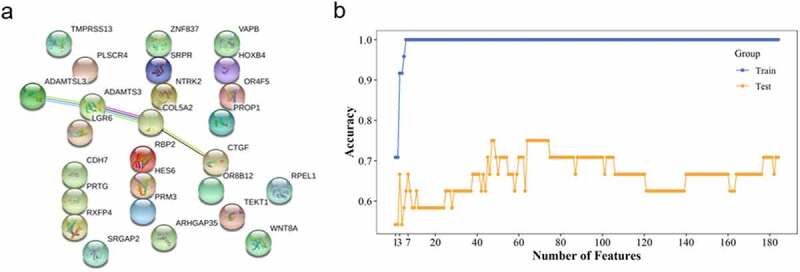
Figure 6.

PPI in specific module and SVM-RFE analysis. (a) The PPI of candidate genes; nodes represent genes, edges to interactions. (b) AUC of model conducted with features in ‘test’ and ‘train’ sets was depicted

PPI in specific module and SVM-RFE analysis. (a) The PPI of candidate genes; nodes represent genes, edges to interactions. (b) AUC of model conducted with features in ‘test’ and ‘train’ sets was depicted