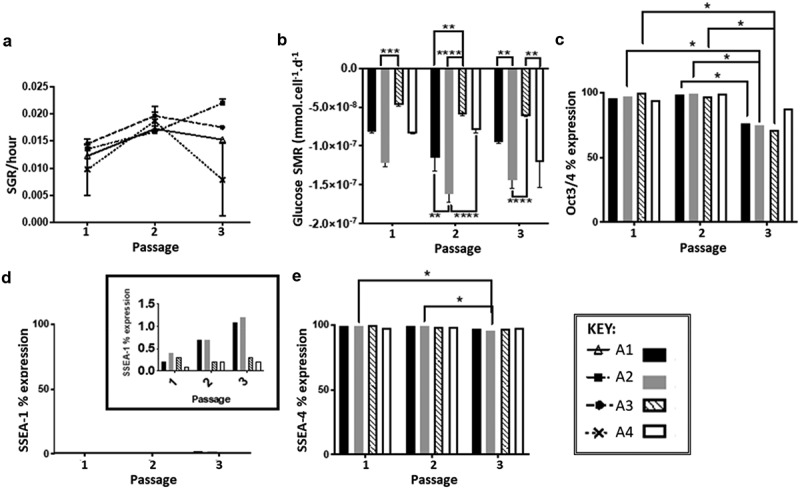
Figure 2.

(a) SGR over three passages, similar values are observed in all culture routes, with the exception of A4 at passages 3 (n= 2). (b) Glucose SMR over three passages demonstrating that route conditions B2 and B4 that have no medium exchange following 48 h have higher SMR compared to route A1 and A3, significant differences between routes at each passage shown on the graph highlight that seeding density, feeding regime and a combination of both parameters result in a different SMRs (n = 2). (c) Oct3/4 marker expression over three passages, expression levels are similar between routes, significant difference observed between passages 2 and 3 for all routes (*p < 0.05) except route A4. (d) SSEA-1 marker expression over three passages, inset shows that percentage expression levels are below 1.5%. (e) SSEA-4 marker expression over three passages, significant differences are observed only within route A2 at the different passages (*p < 0.05). N.B. Oct 3/4 and SSEA-4 are positive markers for pluripotent human embryonic stems, SSEA-1 is a negative marker associated with pluripotency of human embryonic stem cells
