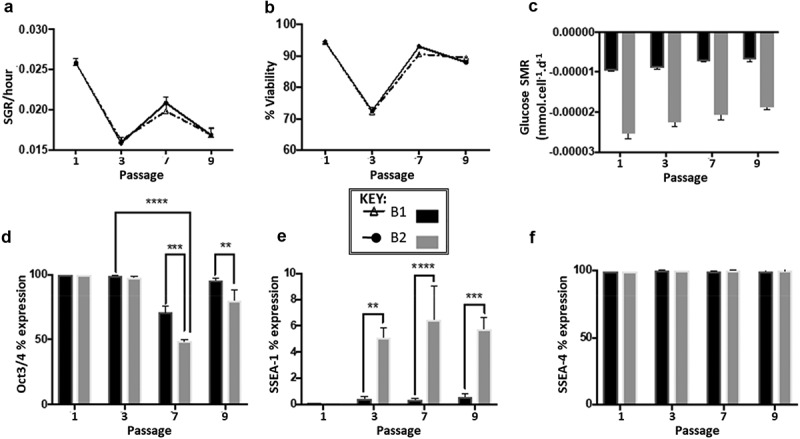
Figure 3.

(a) Specific growth rate trend for route B1 and B2 over 10 passages, showing a fluctuation in SGR throughout all 10 passages that follows the same trend regardless of route, n= 3 error bars showing standard deviation, SD. (b) Cell viability trend of route B1 and B2 over 10 passages both routes follow a similar trend in viability throughout all passages cycles, route B1 had lower viability during 5 of the passage cycles (4−8) in comparison to route B2, n= 2 error bars showing SD. (c) Glucose SMR from passage cycle 2 to 10 demonstrating the significant differences between passages (***p < 0.001), at each individual passage cycle route B2 is significantly higher than route B1 (****p < 0.0001) (d) Oct3/4 marker expression percentages for experiment B at passage cycle 1, 3, 7 and 9 significant differences between passages (****p < 0.0001) and significant differences between culture route B1 and B2 (p = 0.0004, n= 3). (e) SSEA-1 marker expression percentages for experiment significant differences between culture route B1 and B2 at passages 3,7 and 9, B2 exhibited higher expression levels of SSEA-1 compared to B1. (f) SSEA-4 marker expression percentages for experiment B, no significant differences in expression levels are observed both between passages and within the different routes, B1 and B2
