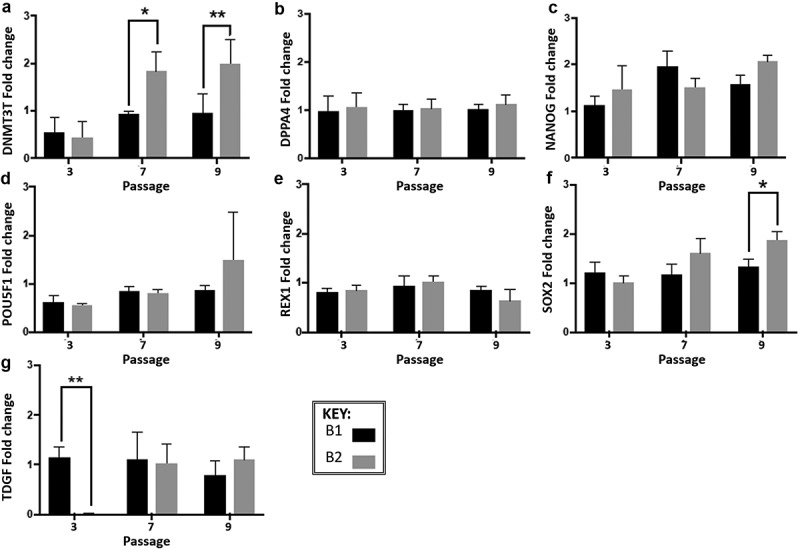
Figure 4.

Gene expression analysis of experiment B at three passage points over the 10 passages (normalized to the cells at passage 1), expression was measured by real-time quantitative reverse transcription-polymerase chain reaction (qRT-PCR). Fold change was calculated using the relative quantity of each gene was calculated by the ΔΔCt method, using a correction for the amplification efficiency of that gene, and normalized to the geometric mean of two housekeeping genes: glyceraldehyde-3-phosphate dehydrogenase and β-actin. Significant differences in fold change at different passage cycles were seen only for A-DNMT3B (***p = 0.0007), NANOG (*p = 0.01) and SOX2 (**p = 0.004). Significant differences between route A1 and A2 were seen only for A -DNMT3B (**p = 0.0032) and F-SOX2 (**p = 0.006). Differences between the two routes within a passage cycle were only observed for G-TDGF (passage cycle 3, **p = 0.018), A-DNMT3B (passage cycle 7, *p = 0.0221; passage cycle 9, **, p = 0.0073), and F-SOX2 (passage cycle 9, *p = 0.0191). Error bars indicate standard deviation (n= 3 for all data presented). N.B. Cells from passage 1 were used as the control sample for the qRT-PCR fold change analysis, therefore no data is presented for passage 1 in the graphs
