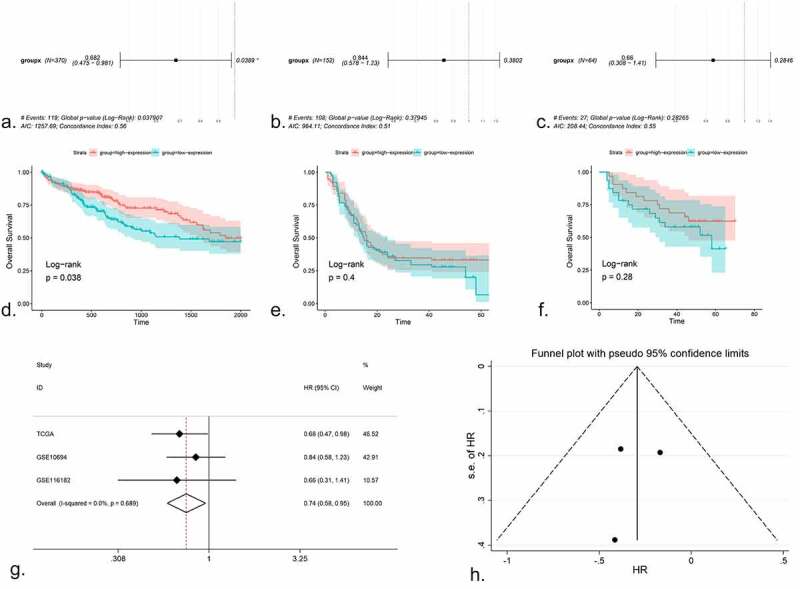
Figure 4.

The prognostic value of miR-125b-2-3p in HCC, the COX regression, K-M plots and SMD were performed. (a-c) COX regression analysis of miR-125b-2-3p in TCGA, GSE10694 and GSE116182. (d-f) K-M plots were performed for TCGA, GSE10694 and GSE116182 respectively. (g) The forest plot was drawn based on the HR. The experimental group was high-expressed miR-125b-2-3p group and the high-expressed miR-125b-2-3p was indicated a great prognosis in HCC. (h) the funnel plot of HR
