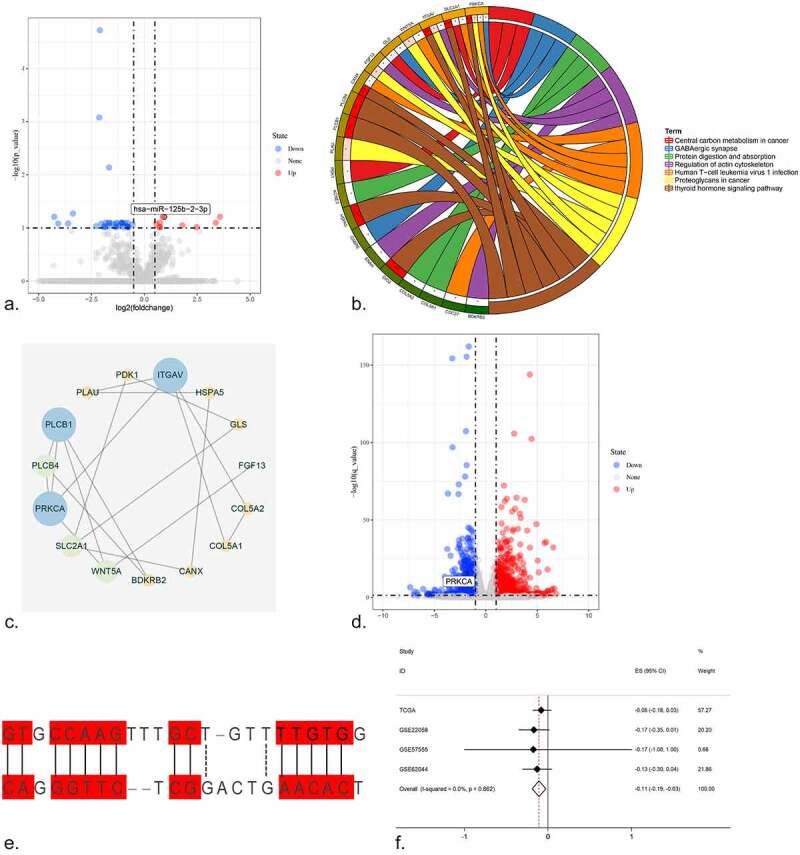
Figure 5.

(a) The volcano plot of miRNAs in HCC cell line. After NC treatment, the expression of miR-125b-2-3p was higher than in control group. (b) The KEGG pathway analysis was performed for the target genes of miR-125b-2-3p. Different colors indicated different terms. (c) The PPI network for all the genes enriched in KEGG pathways. (d) The volcano plot of mRNAs in HCC cell line. Hub gene PRKCA was low-expressed in HCC cell line after NC treatment. (e) The complementary sequence between miR-125b-2-3p and PRKCA. (f) An integrative analysis of correlation analysis between miR-125b-2-3p and PRKCA
