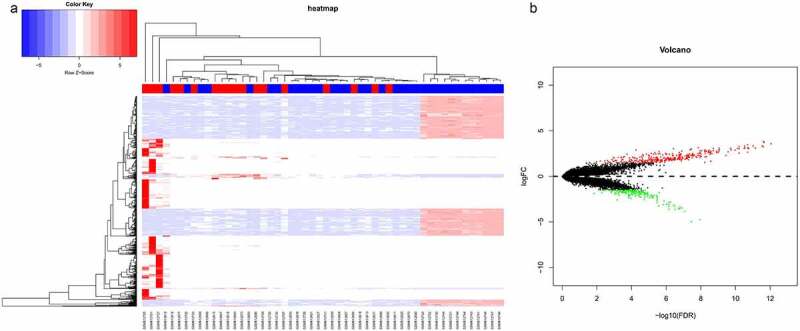
Figure 1.

Differential gene expression analysis of sepsis-induced ARDS and control samples. (a) Bidirectional hierarchical clustering of sepsis-induced ARDS and control samples. Each row represented a gene, each column represented a sample. Sepsis-induced ARDS samples are labeled as red and the control samples are labeled as blue. The heatmap shows the Z-score of relative gene expression of each samples; (b) Volcano plot for DEGs between sepsis-induced ARDS and control samples. X-axes indicates -log (FDR) and y-axes showes the log2 fold change. Red dots represent significantly up-regulated genes and green ones represents the down-regulated genes
