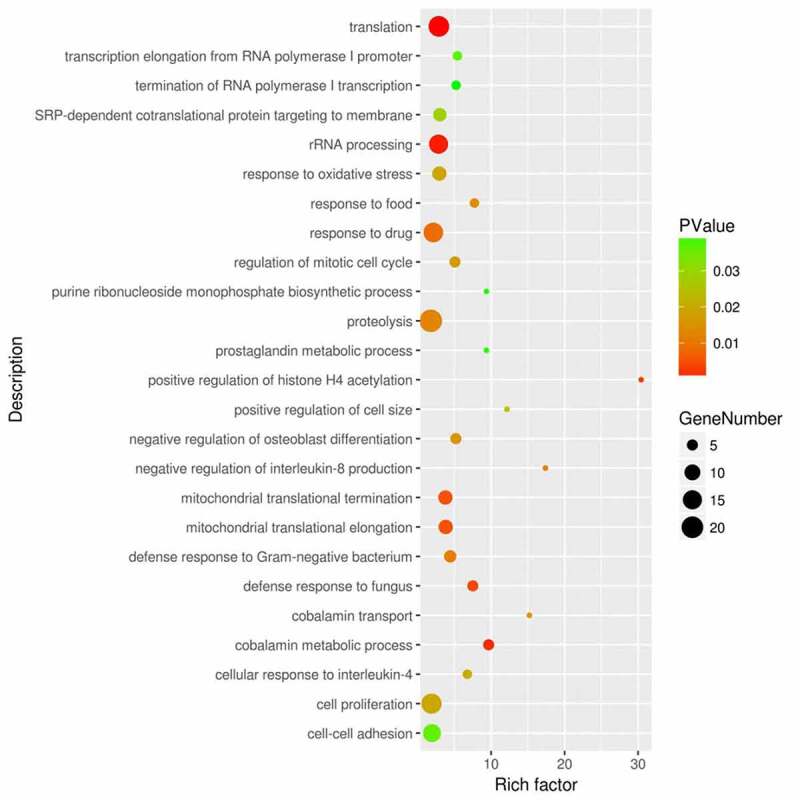
Figure 2.

Functional enrichment analysis of the DEGs between sepsis-induced ARDS and control samples. DAVID bioinformatic tools were used for functional enrichment analysis of the DEGs between sepsis-induced ARDS and control samples. Gene number, enrichment score (rich factor) and the enrichment p value of each biological process were displayed in the bubble plot
