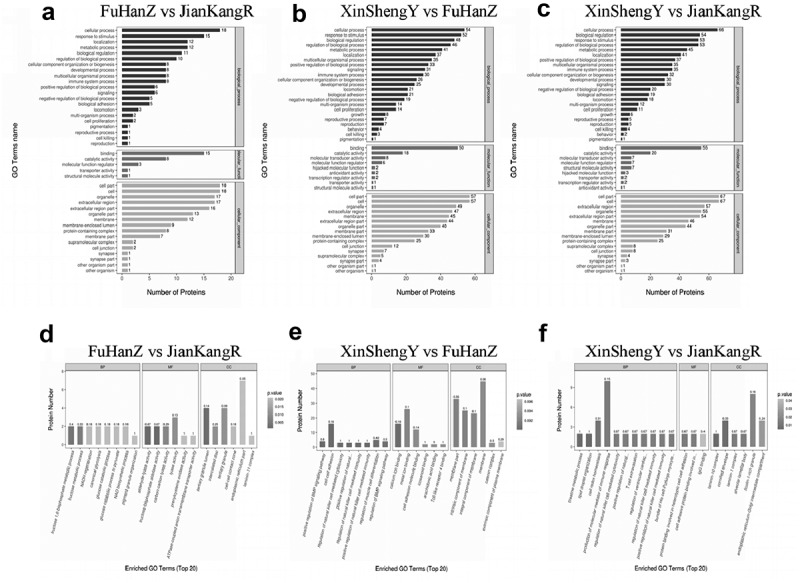
Figure 4.

Gene Ontology (GO) term enrichment analysis of DEPs
(A-C) The number of differential proteins, and the ordinate represents the GO term name. (D-F) The GO functional classification that are enriched, and the ordinate represents the number of differential proteins under each functional classification. The color of the bar graph indicates the significance of the enriched GO function classification, i.e., the P-value has been calculated based on the Fisher’s Exact Test. The color gradient represents the size of the P-value, and the color changes from orange to red. The closer the red indicates the smaller the P value, the higher the significance level of the enrichment of the corresponding GO function category; the label above the bar graph shows the enrichment factor (richFactor ≤ 1). FuHanZ represents CCS patients; JianKangR represents healthy control; XinShenY represents HKYAD patients.
