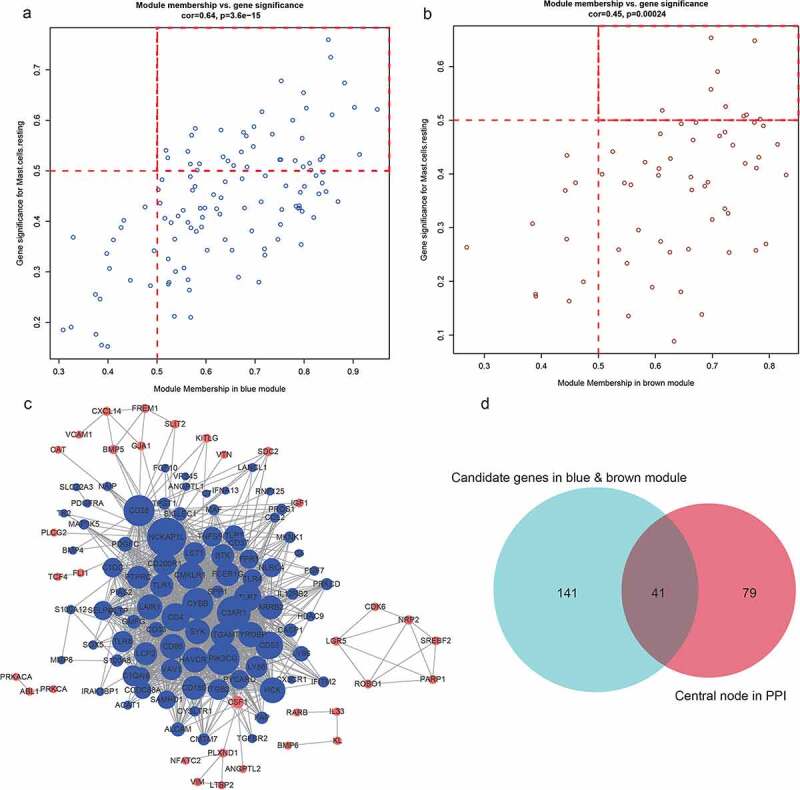
Figure 6.

A, B. The genes and modules of the blue and brown modules and the correlation of different immune cell characteristics. C. The interaction network of the blue and brown modules. In the figure, blue represents the genes of the blue module, brown represents the genes of the brown module, node size represents the degree of the node. D. Venn diagram of the candidate hub gene and PPI network graph
