Figure 9.

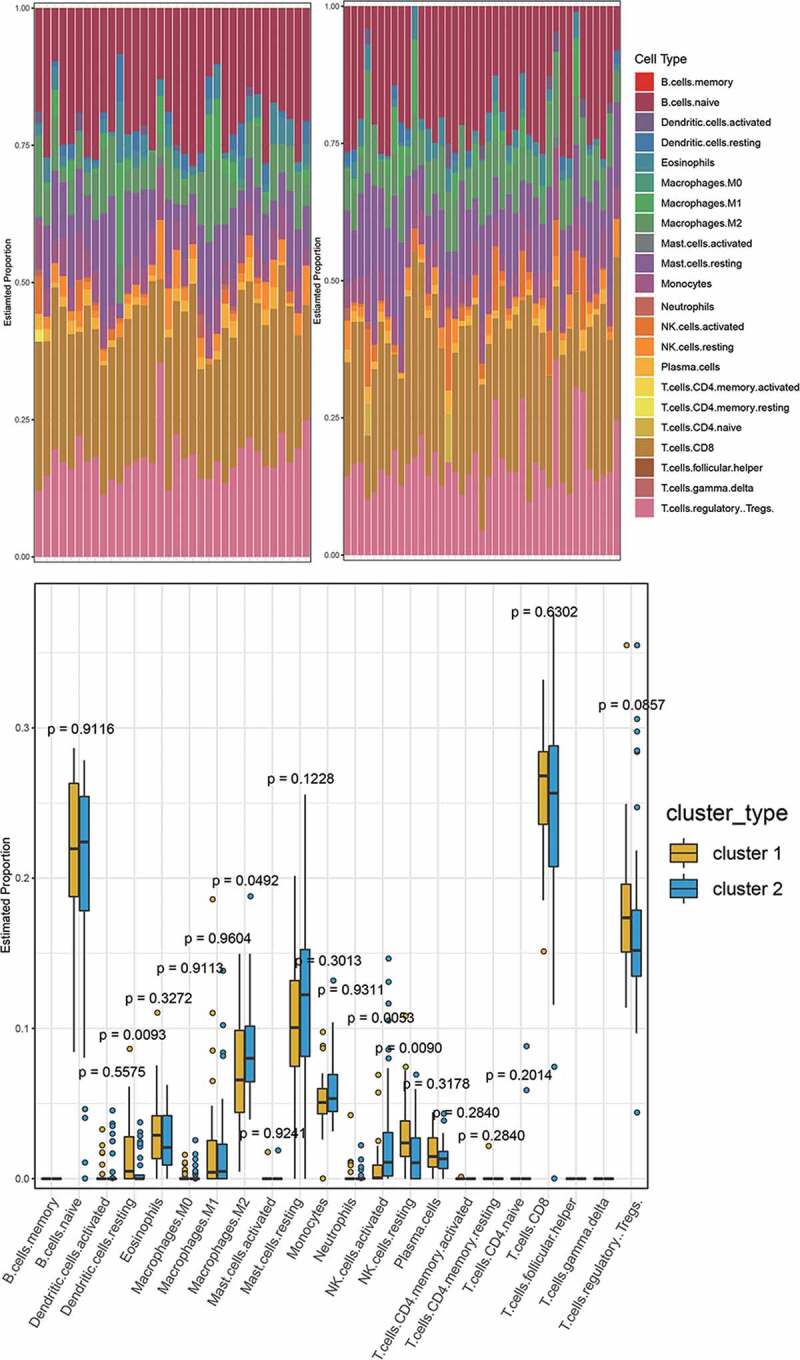
A. The immune cell infiltration in cluster 1 and cluster 2. B. The difference of immune cell infiltration between cluster 1 and cluster 2 (Wilcoxon’s test, p < 0.05)

A. The immune cell infiltration in cluster 1 and cluster 2. B. The difference of immune cell infiltration between cluster 1 and cluster 2 (Wilcoxon’s test, p < 0.05)