
Figure 4.
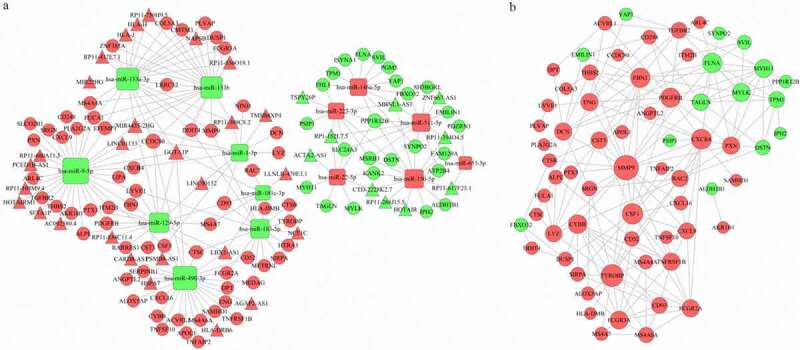
The ceRNA network (a) and the PPI network (b). Red indicates upregulation, and green indicates downregulation. The circle nodes represent DEGs, the rectangle nodes represent DEMs, and the triangle nodes represent DELs
Official websites use .gov
A
.gov website belongs to an official
government organization in the United States.
Secure .gov websites use HTTPS
A lock (
) or https:// means you've safely
connected to the .gov website. Share sensitive
information only on official, secure websites.
The ceRNA network (a) and the PPI network (b). Red indicates upregulation, and green indicates downregulation. The circle nodes represent DEGs, the rectangle nodes represent DEMs, and the triangle nodes represent DELs