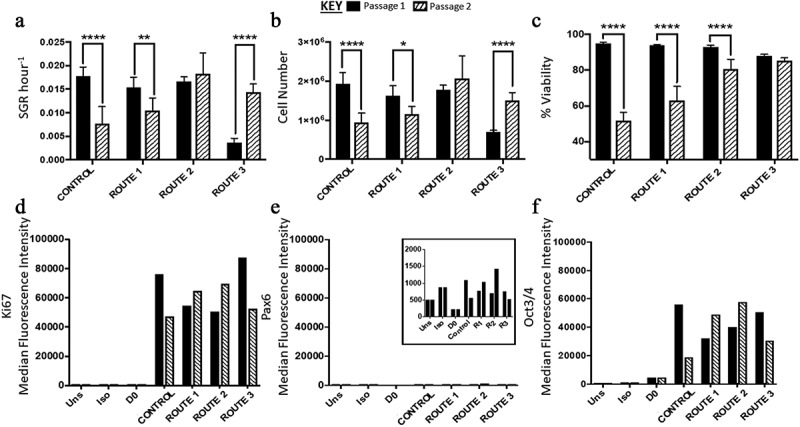
Figure 3.

Analysis of H9 human embryonic stem cells (hESCs) growth dynamics for cells cultured under four different feeding regime routes. (a) Specific growth rate (SGR) decreased from passage 1 to 2 for the control and route 1 conditions, no significant difference was observed for route 2, while route 3 significantly increased from passage 1 to 2. (b) The same trend observed in the SGR was observed with the cell number yields from passage 1 to 2, i.e., only route 2 did not have a significant change in cell number between the two passages. (c) The control, route 1 and route 2 all had a decrease in cell viability from passage 1 to passage 2, which was not observed for route 3. Ki67 (d) and Oct2/4 (f) were both highly expressed in all the conditions. Pax6 median fluorescence intensity (MedFI) expression levels were very low in comparison to Oct3/4 and Ki67, inset shows the very low levels of Pax6 (3E), all conditions were under 1,500 for their MedFI values. Error bars indicate standard deviation, n = 3. ‘*’ indicates p < 0.05, ‘**’ indicates p < 0.01, ‘***’ indicates p < 0.001, and ‘****’ indicates p < 0.0001. Uns = unstained; Iso = isotype; D0 = cells at day 0; R1 = route 1; R2 = route 2; R3 = route 3
