
Figure 4.
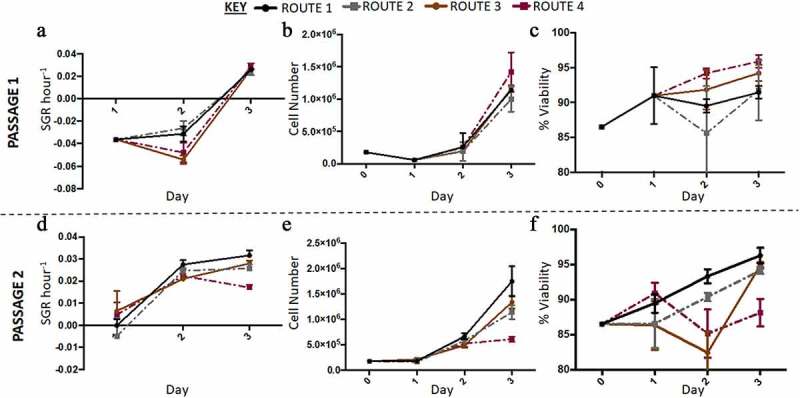
Growth dynamics of H9 cells with higher resolution cell count was carried out in the second run in Experiment B: the effect of feeding regimes. (a) Overall, the specific growth rate (SGR) was lower at passage 1, with all four conditions having negative SGRs until day three of passage 1. (d) At passage 2, route 2 and route 3 had a positive SGR from day one onwards, only route 3 had a significant decrease in SGR by day three of passage 2. At both passages the cell number increased from day 0 to day three, however at passage 1 (b) there was a decrease in cell number from day 0 to 1, not observed at passage 2 (e). Generally, cell viability increased throughout passage 1, except for route 1 which had a decrease on day two (c). At passage 2, route 2 and route 3 had variable cell viabilities from day to day, while the control and route 1 had increased cell viabilities from day to day (f). Error bars indicate standard deviation, n = 3.