
Figure 6.
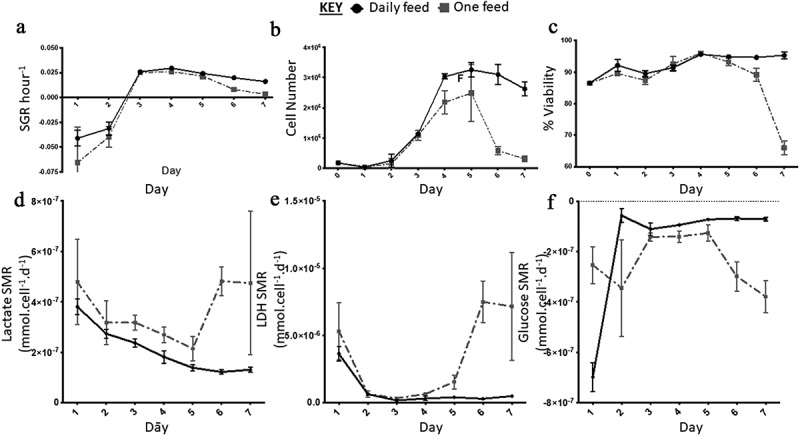
Growth dynamics. (a) Specific growth rate (SGR) increased from negative SGR to positive SGR from day three onwards peaking at day four for the daily feed (DF) condition and day three for the one feed (OF) condition. OF had a greater decrease in SGR over the seven-day culture period, SGR differed between the two conditions on day one (p = 0.0012). (b) Cell number decreased from day five onwards for both conditions, similar to the SGR OF has the most notable decrease in cell number and cell viability (c). From day four onwards there was a significant difference in cell number yield between the two conditions: day 4 (p < 0.0001); day 5 (p = 0.0002); day 6 (p < 0.0001); day seven (p < 0.0001). Error bars indicate standard deviation, n = 6. Lactate SMR decreased throughout the passage for daily feed (DF), one feed (OF) decreased until day five to six when it increased significantly (p = 0.0079) (d). Lactose dehydrogenase (LDH) specific metabolite rate (SMR) was highest from day five to six for the OF condition, the DF condition had low levels of LDH production over the seven-day culture period (e). Significant differences in SMR between the two conditions for both lactate and LDH were observed at day six (p < 0.0001) and day seven (p < 0.0001). Glucose SMR was high at day one for the DF condition after which it significantly decreased from day two onwards and plateaued (f). Error bars indicate standard deviation, n = 3