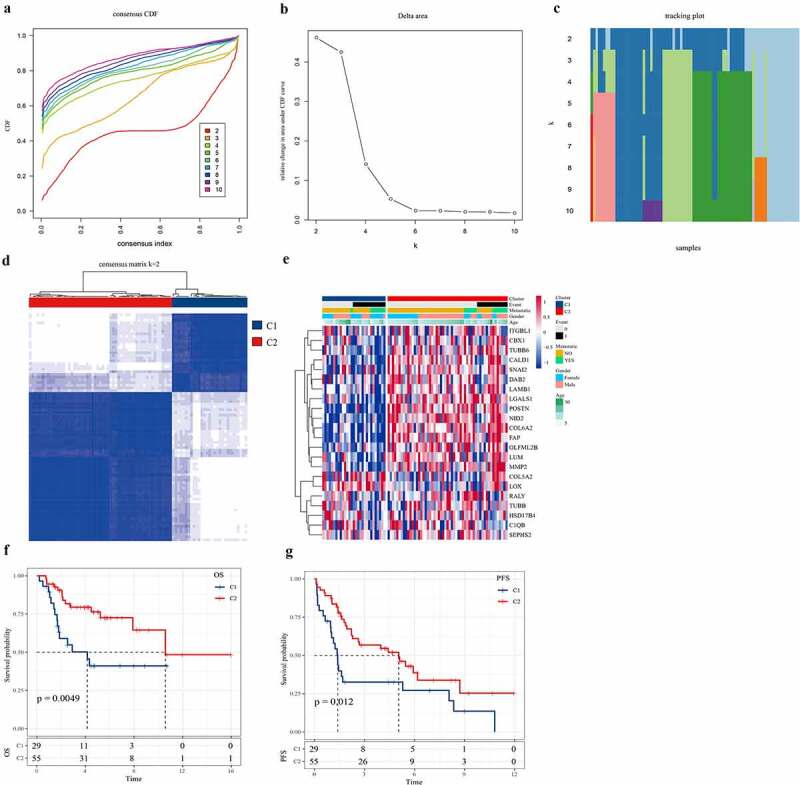
Figure 2.

Consensus clustering identified two molecular subtypes of osteosarcoma invasion.
a: The CDF value of the consensus index. b: The relative change of the area under the CDF curve with k between 2 and 10. c: Tracking map of Kraft 2–10. d: The CM diagram shows the clustering at k = 2. e.g., 22 invasion-related gene clustering heat maps. f: Survival analysis assessed the association between C1 or C2 and overall survival. g: Survival analysis assessed the association between C1 and C2 and PFS.
