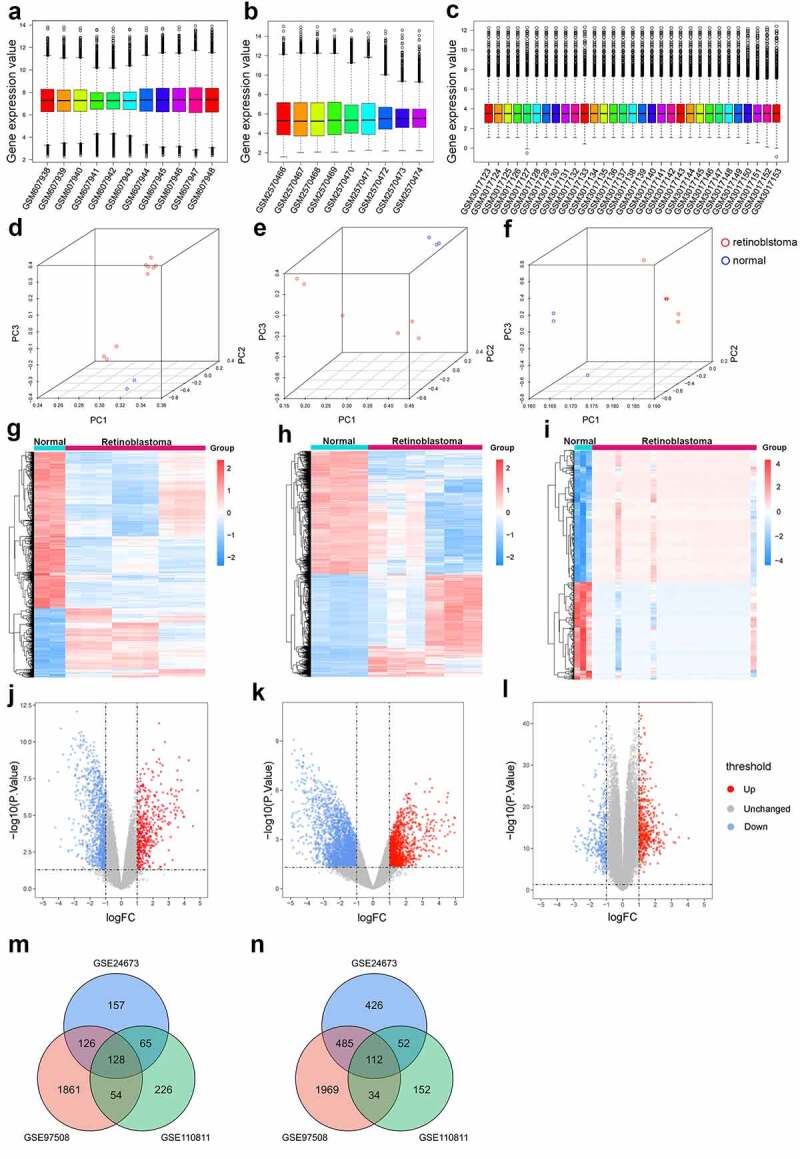
Figure 1.

Identification of differentially expressed genes in retinoblastoma. (a-c) Box plots of gene expression profiles after data standardization in GSE24673 (a), GSE97508 (b), and GSE110811 (c). (d-f) Principal component analysis of retinoblastoma samples and normal control samples in GSE24673 (d), GSE97508 (e), and GSE110811 (f). (g-i) Heatmap of differentially expressed genes identified in GSE24673 (g), GSE97508 (h), and GSE110811 (i). (j-l) Volcano plot of differentially expressed genes identified in GSE24673 (j), GSE97508 (k), and GSE110811 (l). (m-n) Venn diagram of overlapping upregulated (m) and downregulated (n) differentially expressed genes from the three datasets
