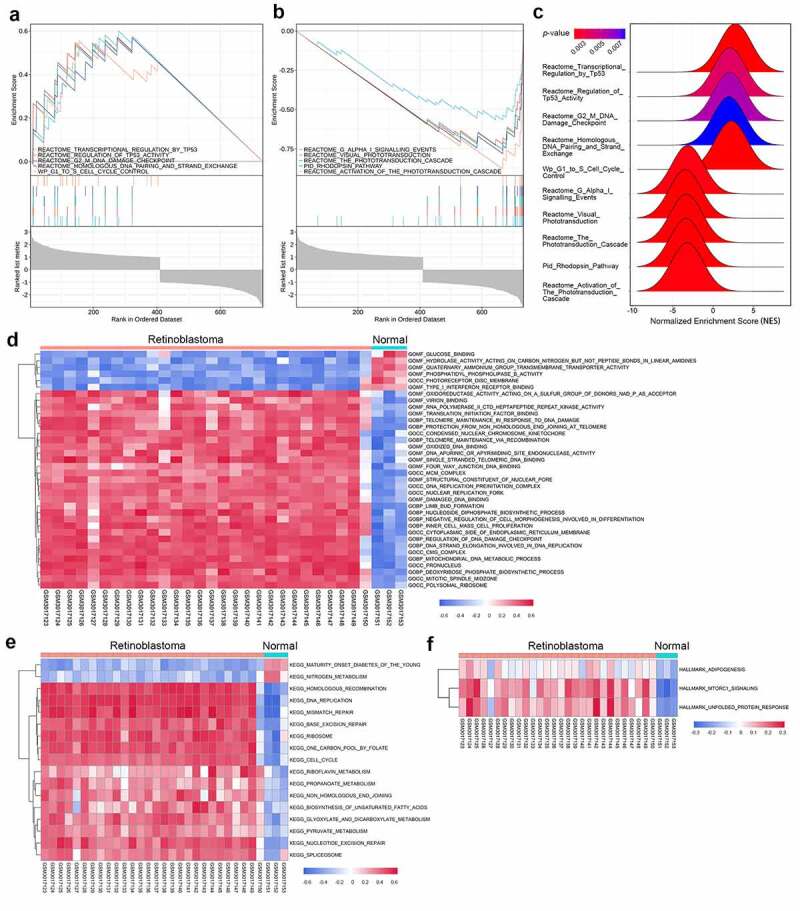
Figure 3.

Gene set enrichment analysis (GSEA) and gene set variation analysis (GSVA) in the GSE110811 dataset. (a-b) Multi-GSEA plot showing the five most significantly upregulated pathways (a) and the five most significantly downregulated pathways (b) in GSE110811 samples. (c) Ridge plot displaying the normalized enrichment score (NES) of the above ten pathways. (d-f) Heatmap of GSVA results showing GSVA scores of the GO gene set (d), KEGG gene set (e), and hallmark gene set (f) enriched in GSE110811
