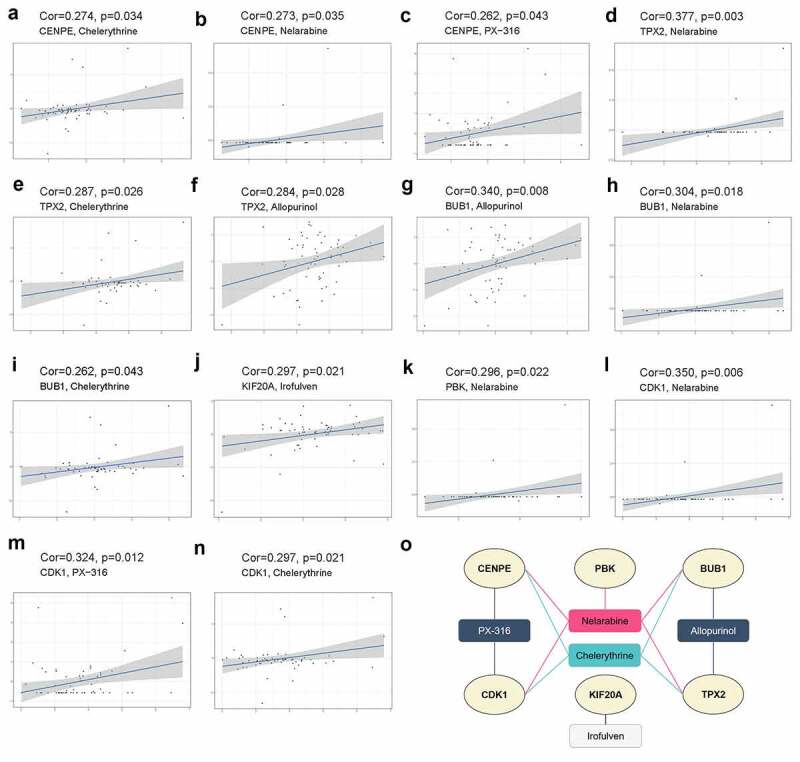
Figure 5.

Drug sensitivity analysis of six hub genes using NCI‐60 cell line data in the CellMiner database. (a-n) Scatter plots displaying the most significant positive correlations between hub genes CENPE (a-c), TPX2 (d-f), BUB1 (g-i), KIF20A (j), PBK (k), CDK1 (l-n) and drug sensitivity based on Pearson correlation. (o) Network of the six hub genes and sensitive drugs. Ellipses indicate hub genes in light yellow, and rectangles represent sensitive drugs targeting these hub genes
