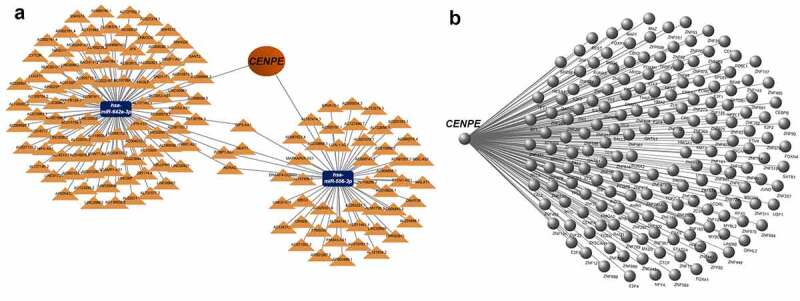
Figure 7.

The CENPE-miRNA-lncRNA competing endogenous RNA (ceRNA) network and CENPE-transcription factor interaction network. (a) ceRNA network. Orange triangles represent lncRNAs and blue rectangles represent miRNAs. (b) Transcription factor network for CENPE. The right part of the diagram indicates the transcription factors predicted to interact with CENPE.
