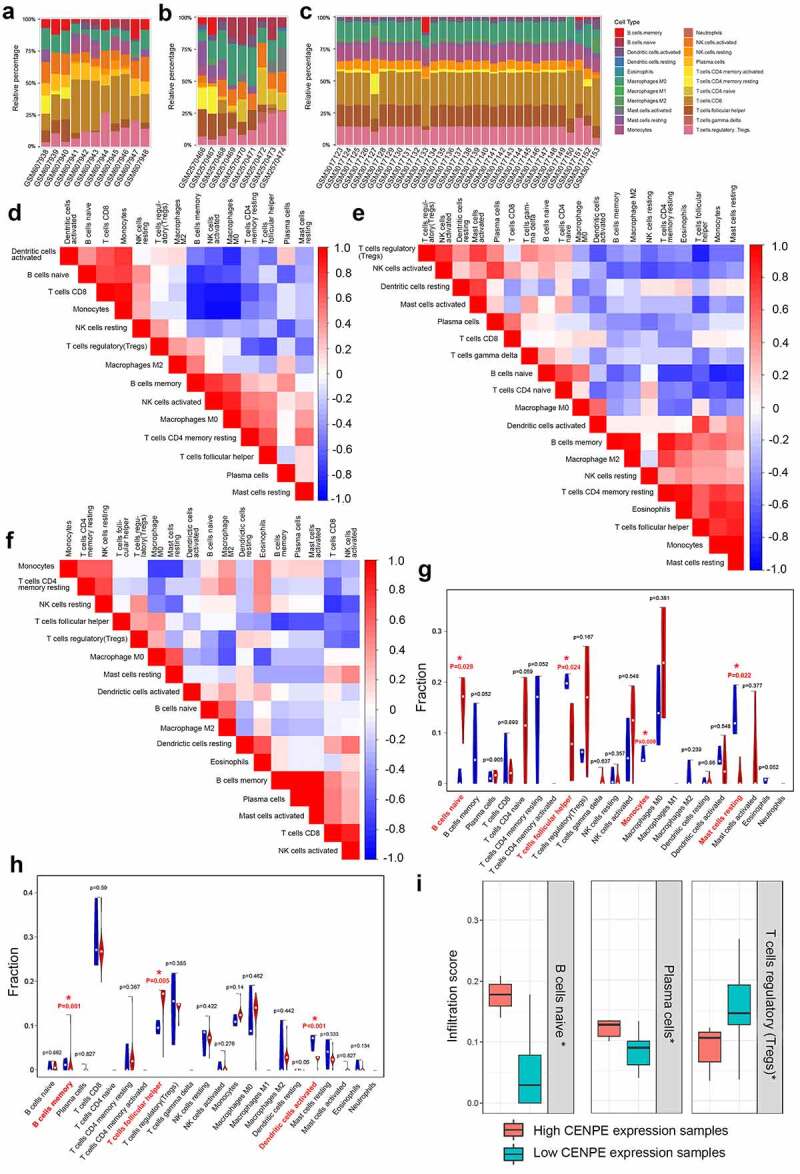
Figure 8.

Profile of immune infiltration in retinoblastoma and normal retinas. (a-c) The proportions of immune cells in each sample of GSE24673 (a), GSE97508 (b), and GSE110811 (c) are displayed with different colors, and the lengths of the bars in the stacked bar chart indicate the proportion of each immune cell population. (d-f) Correlation matrices of immune cell proportions in GSE24673 (d), GSE97508 (e), and GSE110811 (f). A positive correlation is indicated in red, while a negative correlation is indicated in blue. The darker the color, the stronger the correlation. (g-h) Differences in the proportion of each immune cell in retinoblastoma and normal samples of GSE97508 (g) and GSE110811 (h). Blue represents normal retinas, and red represents retinoblastoma tissues. * P < 0.05. (i) Comparison of immune cells in samples with high and low CENPE expression. * P < 0.05
