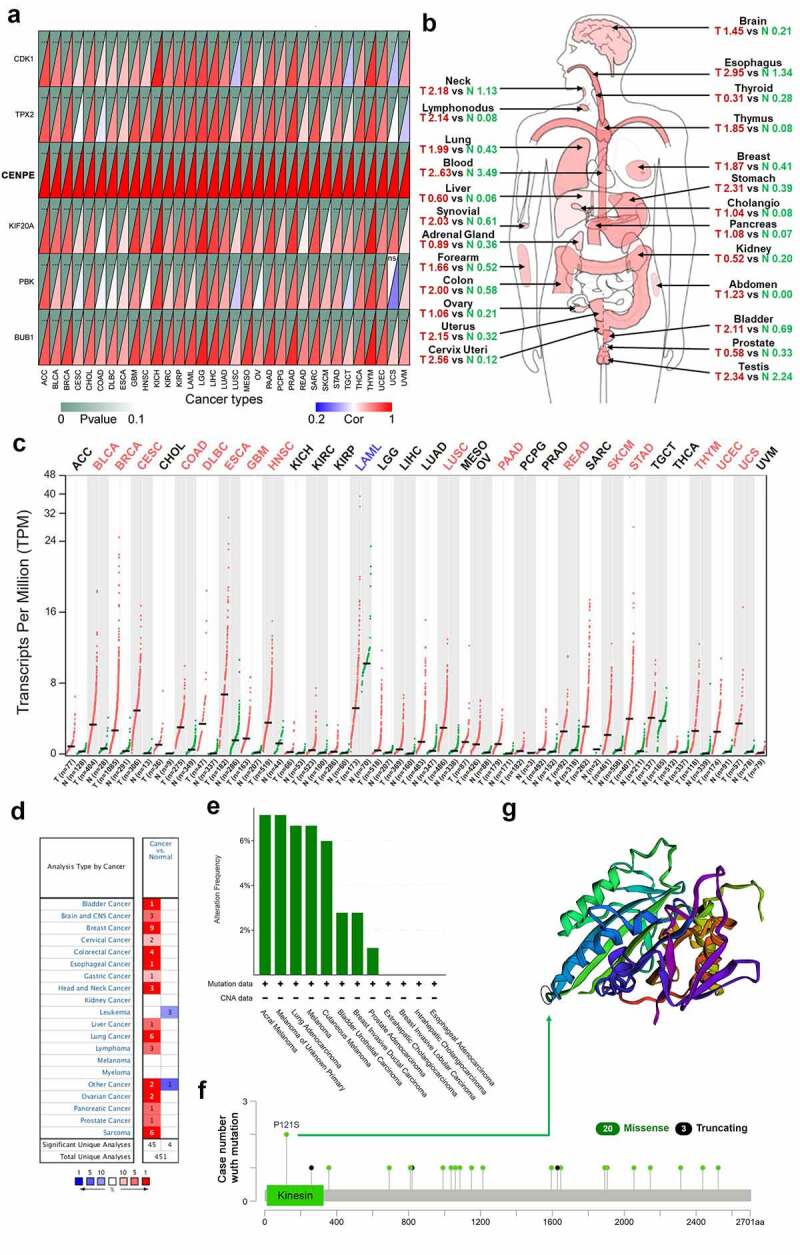
Figure 9.

Expression profiles and mutation features of CENPE in different types of human cancers. (a) Correlation analysis of CENPE expression and the other five hub genes across thirty-three cancer types. The lower right rectangles in red color represent positive correlations whereas blue rectangles represent negative correlations. The darker the color, the stronger the correlation. The upper left rectangles represent the P value. As the P value approaches zero, the color of the triangle is closer to dark green. ***P < 0.001, **P < 0.01. (b) The median expression of tumor and normal samples in a body map. A darker red color corresponds to a higher gene expression level. T, tumor (red); N, normal (green). (c) Dot plot showing the expression profile of CENPE across thirty-three tumor samples and paired normal tissues. Red dots represent tumor samples while green dots represent normal samples. Tumor annotations in red represent significant CENPE upregulation and blue represents significant CENPE downregulation. (d) Expression of CENPE in different types of cancers compared with normal samples in the Oncomine database. (e-f) The alteration frequency with mutation type (e) and site (f) of CENPE in pan-cancers based on the cBioPortal database. (g) The mutation site with the highest alteration frequency (P121S) is marked with a circle in the crystal structure of CENPE
