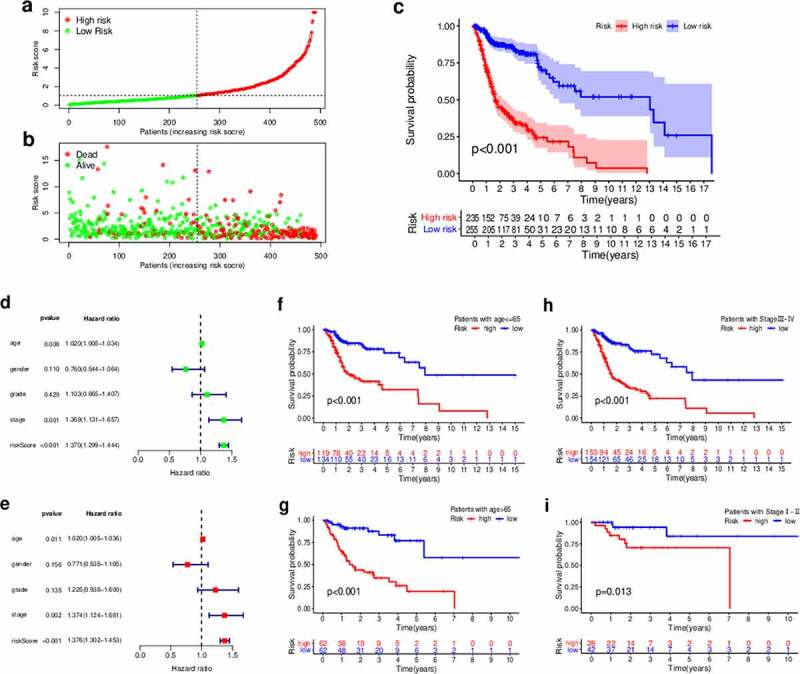
Figure 4.

Prediction of the survival of HNSCC patients and identification of the risk factors using the risk score model and univariate and multivariate Cox analyses, respectively. (a, b) Patients were scored and grouped into a low-risk group (green) and a high-risk group (red). Then, scatter diagrams of the survival rate of patients were plotted based on the risk scores from low to high, with green indicating live patients and red indicating deaths. (c) Kaplan–Meier survival curves. (d) Univariate analysis. (e) Multivariate analysis. (f, g) Kaplan–Meier curve analysis of the overall survival (OS) in the high- and low-risk groups, in the context of young and old patients. (h, i) Kaplan–Meier curve analysis of the OS in the high- and low-risk groups in the context of early-stage and late-stage patients. Statistical analysis was performed using the log-rank test
