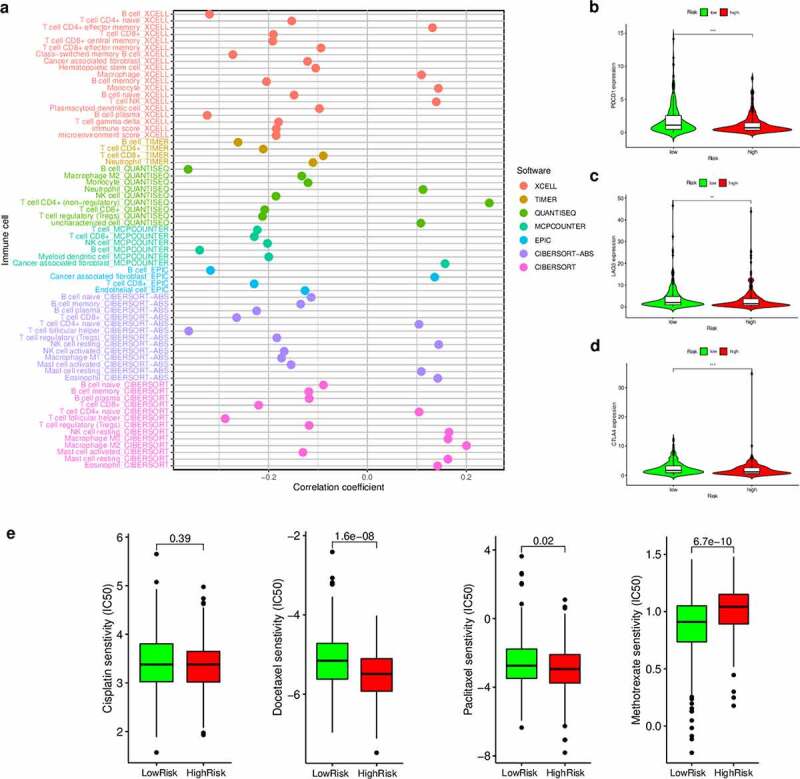
Figure 7.

Estimation of tumor-infiltrating cells, immunosuppression molecules, and the IC50 values of chemotherapeutics using the risk assessment model. (a) Lollipop diagram of the correlation between the risk scores and immune cell infiltration. (b–d) Violin plots of the expression of genes related to Immune checkpoint inhibitors in the low- and high-risk groups. (e) Boxplots highlighting the difference in the IC50 values of cisplatin, docetaxel, methotrexate, and paclitaxel between the high- and low-risk groups
