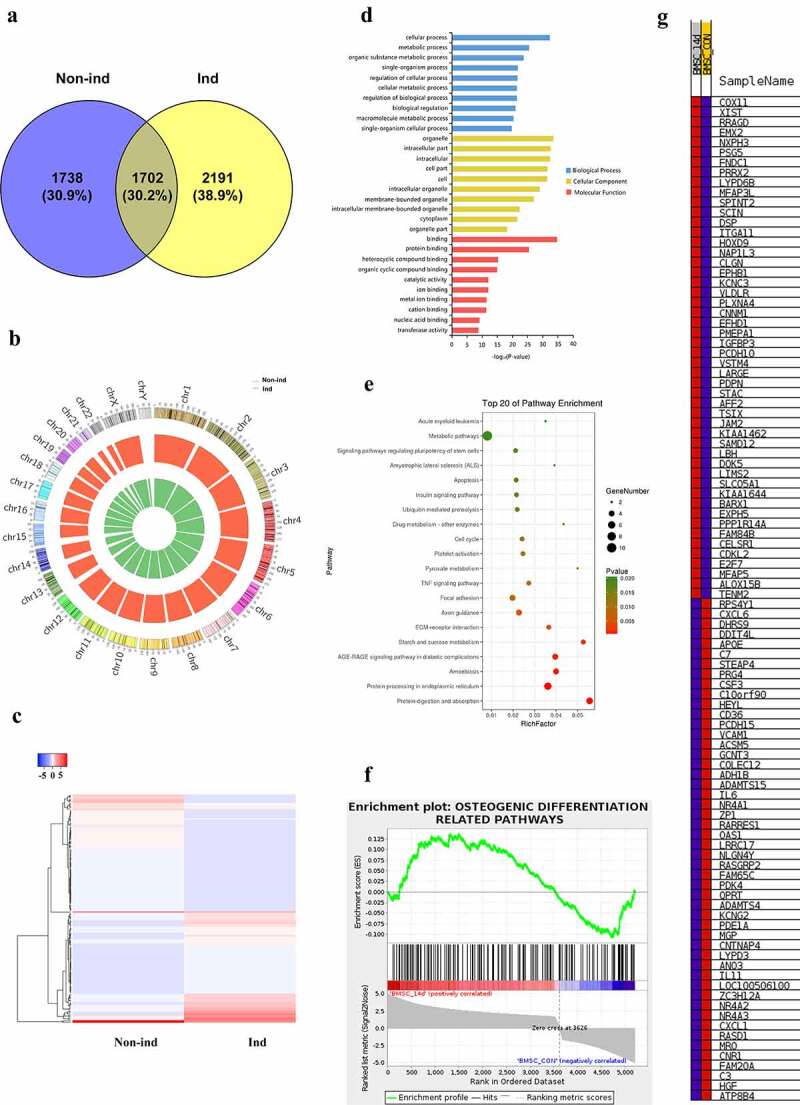
Figure 2.

(a) Differentially expressed cirRNAs profile and function analysis. Venn diagram showed the number of circRNAs detected in Non-ind group and Ind group. (b) Chromosomes distribution of circRNAs. Non-ind group: inner green circle; Ind group: outer red circle. (c) Heat map of differential circRNAs in Non-ind group and Ind group. (d) GO analysis result of the parent gene of differentially expressed circRNAs in biological process, cellular component, molecular function. (e) KEGG analysis result of the parent gene of differentially expressed circRNAs. (f) GSEA analysis result of the parent genes of differentially expressed circRNAs being involved in osteogenic differentiation-related pathways. (g) Heat map of the parent genes of differentially expressed circRNAs in GSEA analysis
