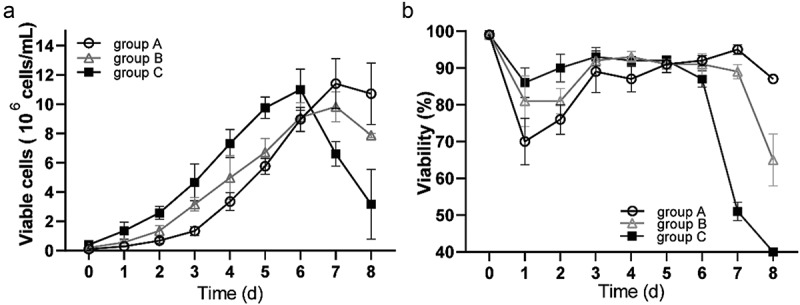
Figure 2.

Growth results over 8 d of adapted suspension 293 T cells with cell densities of 1.0 × 10⁵ cells/mL (group A), 2.0 × 10⁵ cells/mL (group B), and 4.0 × 10⁵ cells/mL (group C), respectively. (a) live cell growth curve; (b) cell viability percentages. data are means (SD) of 3 experiments
