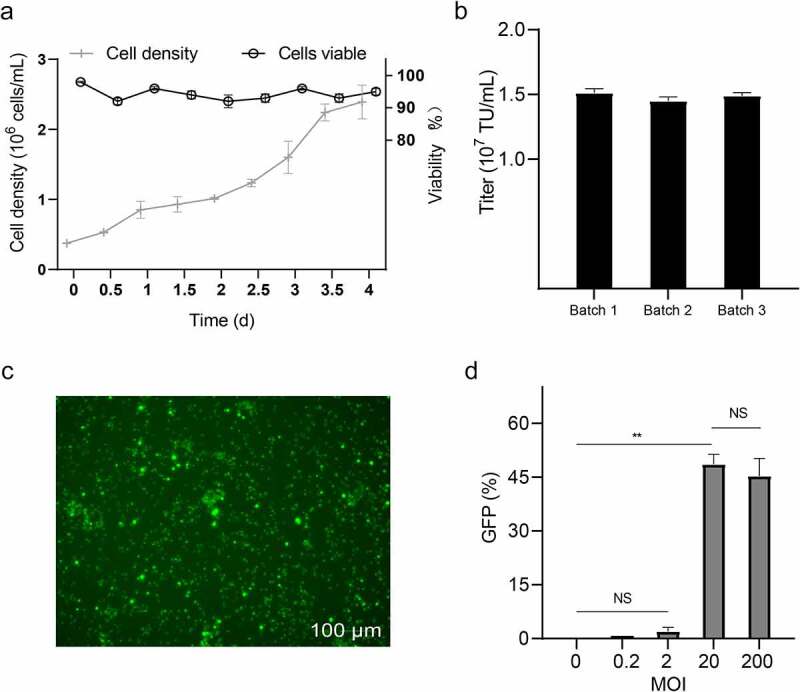
Figure 5.

Verification of the virus packaging capability of 293 T suspension cells in a 5.5 L working volume bioreactor. (a) the percentage of cell growth curve and viability during fermentation; (b) titer of the 293 T suspension cells packing the LV data are means (SD) of 3 experiments. (c) observation of GFP expression in T cells after transduction using 100 µm for green field microscopy. (d) inoculated T cells at a multiplicity of transduction (MOI) of 0, 0.2, 2, 20, and 200 viruses were detected using a flow cytometer. data are means (SD) of 3 experiments. **P < 0.01, NSP ˃ 0.05
