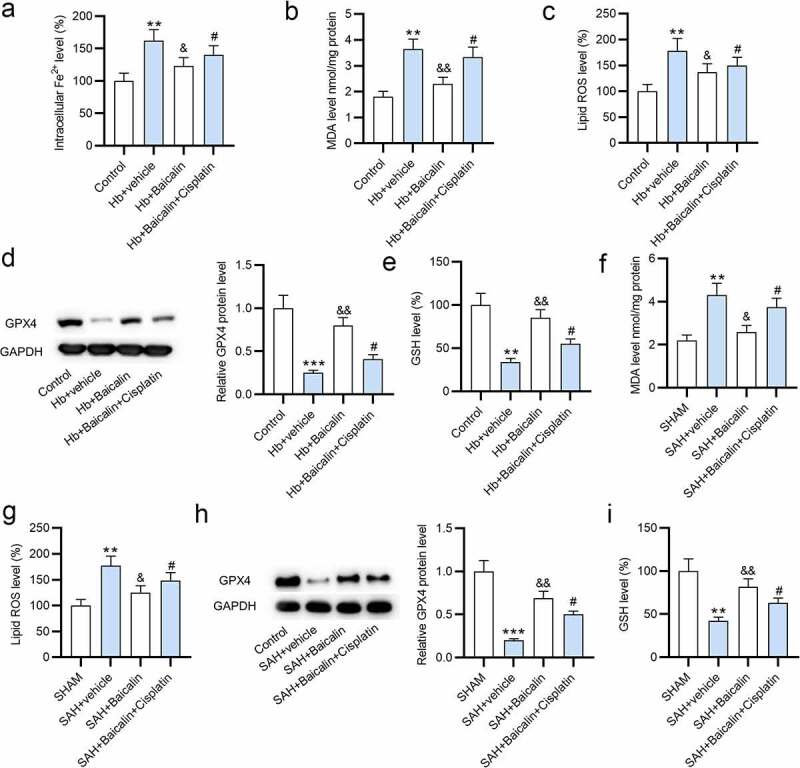
Figure 3.

Effects of baicalin on Fe2+, MDA, GSH, and ROS levels. (a) The levels of Fe2+, (b) MDA, and (c) ROS in the primary neurons in 4 groups: (i) Control, (ii) Hb + vehicle, (iii) Hb + Baicalin, (iv) Hb + Baicalin + Cisplatin. (d) The protein level of GPX4 was revealed by western blot analysis. (e) The level of GSH in the four groups. (f-i) The measurement of MDA, ROS, GPX4 and GSH in the brain tissues of rats in 4 groups: (i) SHAM, (ii) SAH + vehicle, (iii) SAH + Baicalin, (iv) SAH + Baicalin + Cisplatin. There are 10 rats in each group. **P < 0.01, ***P < 0.001 versus control or sham group. &P < 0.05, &&P < 0.01 versus Hb + vehicle group or SAH + vehicle group. #P < 0.05 versus Hb + Baicalin group or SAH + Baicalin group
