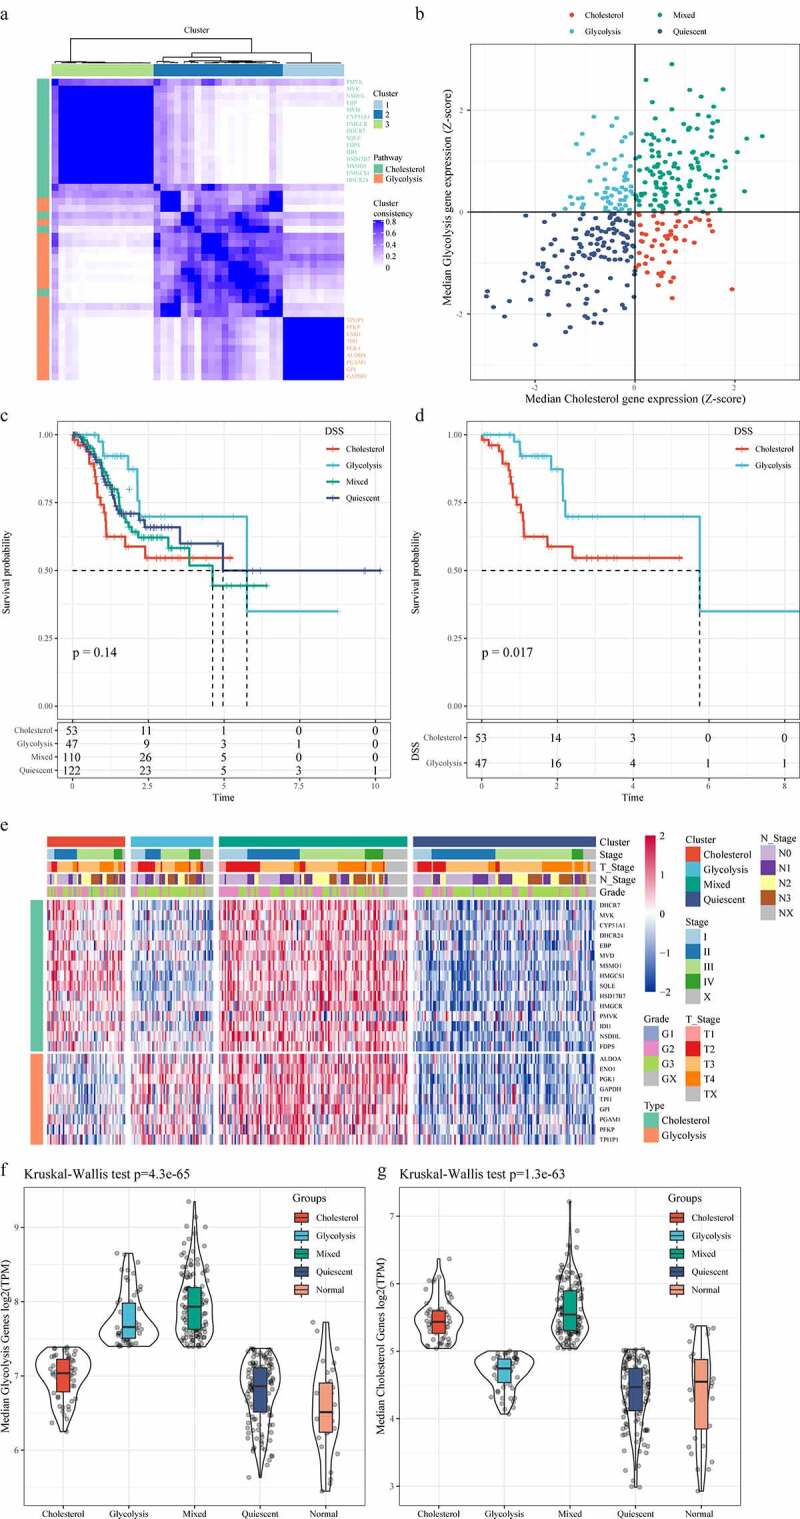
Figure 1.

Identification of molecular subtypes of gastric cancer. A: Consistent clustering of glycolysis and cholesterol genes. B: Samples were classified into four subtypes according to glycolysis and cholesterol gene expression levels (Quiescent, Glycolysis, Cholesterol and Mixed). C: Disease-specific survival time prognostic survival curves of the four molecular subtypes. D: Disease-specific survival time prognostic survival curves of the Cholesterol and Glycolysis subtypes. E: Heatmaps of 24 Cholesterol- and Glycolysis-related genes. F: Glycolysis Genes expression levels in four subtypes and normal groups in the TCGA dataset. G: Cholesterol Genes expression levels in four subtypes and normal groups in the TCGA dataset
