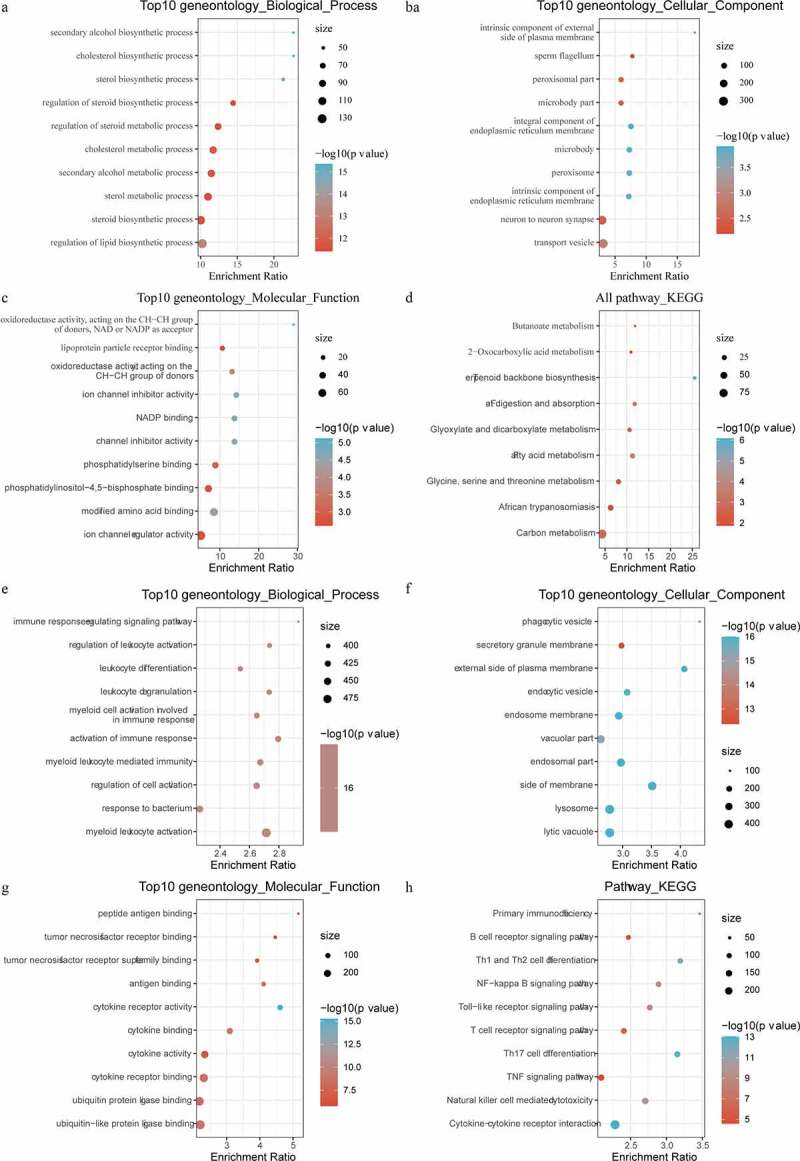
Figure 7.

Functional enrichment analysis of differentially expressed genes. A: Pathways annotated on BP for up-regulated expressed genes. B: Pathways annotated on CC for up-regulated expressed genes. C: Pathways annotated on MF for up-regulated expressed genes. D: Pathways annotated on KEGG for up-regulated expressed genes. E: Pathways annotated on BP for down-regulated expressed genes. F: Pathways annotated on CC for down-regulated expressed genes. G: Pathways annotated on MF for down-regulated expressed genes. H: Pathways annotated on KEGG for down-regulated expressed genes
