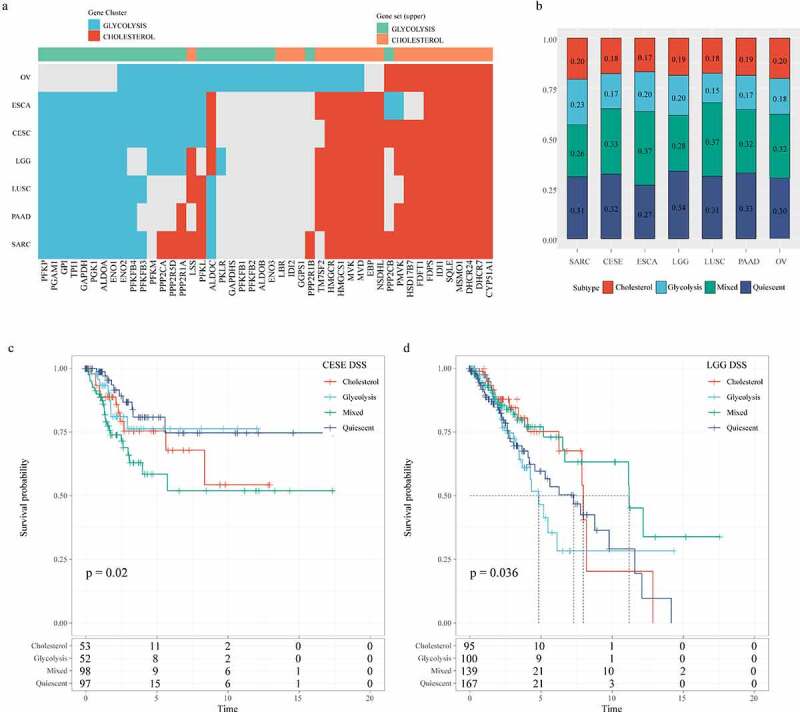
Figure 9.

Correlation analysis of glycolysis and cholesterol gene clusters with pan-cancer types. A: Clusters of co-expression pathway-specific genes in seven cancer types (OV, ESCA, CESE, LGG, LUSC, PAAD, SARC). B: The seven cancer types are also classified into four metabolic subtypes according to the clustering glycolysis and cholesterol gene expression levels. C: Disease-specific survival time prognostic survival curves of the four molecular subtypes in CESE. D: Disease-specific survival time prognostic survival curves of the four molecular subtypes in LGG
