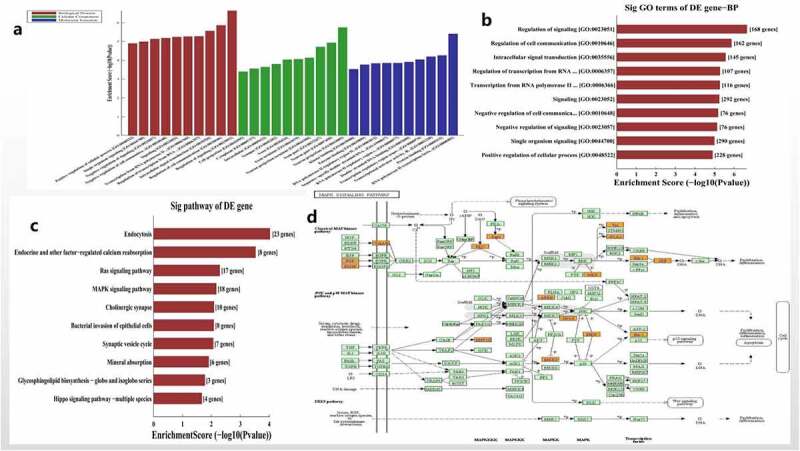
Figure 3.

Functional and pathway enrichment analysis of hsa_circ_0006766. (a) Results of GO analysis. (b) Top 10 GO terms (biological processes) determined by GO analysis according to the enrichment score. (c) Top 10 pathways determined by KEGG analysis according to the enrichment score. (d) Map of hsa_circ_0006766-mediated MAPK signaling pathway
