Figure 1.

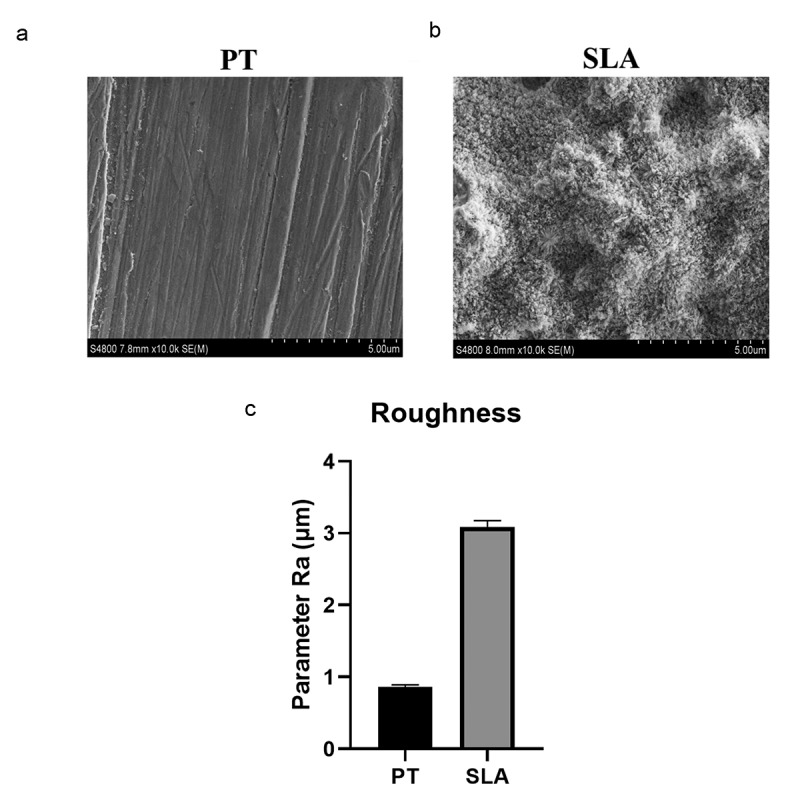
The surface characterization of different titanium. The SEM picture of PT group (a) and SLA group (b), and the mean values of the different titanium surfaces (c)

The surface characterization of different titanium. The SEM picture of PT group (a) and SLA group (b), and the mean values of the different titanium surfaces (c)