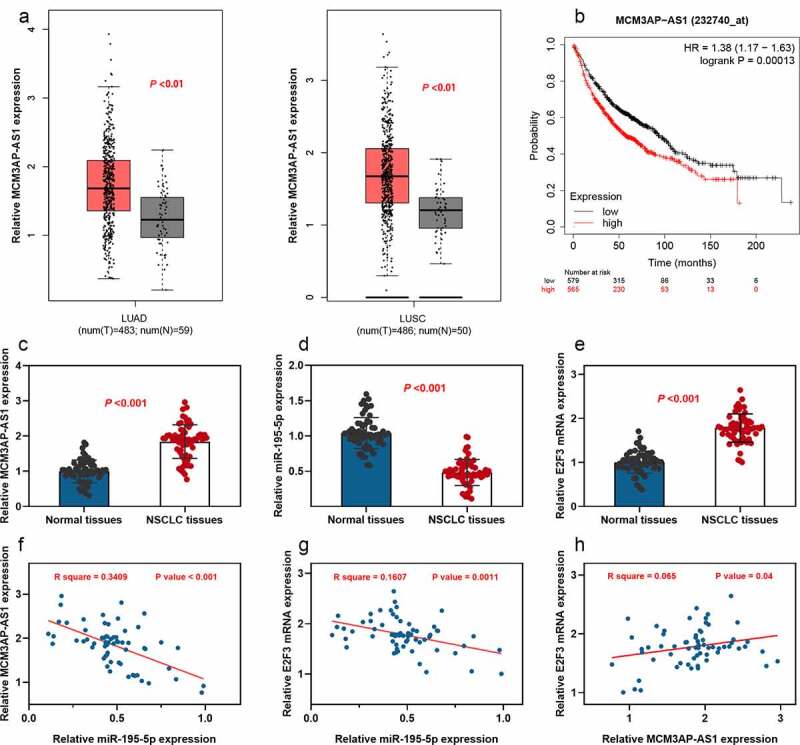
Figure 1.

Expression of MCM3AP-AS1, miR-195-5p and E2F3 in NSCLC
(a) Analysis of MCM3AP-AS1 expression in NSCLC tissues (LUAD: n = 483; LUSC: n = 486) and non-cancerous tissues (N = 50) was conducted using the online database GEPIA (Match TCGA normal data). (b) Kaplan–Meier plotter database was used to conduct Kaplan–Meier analysis of the overall survival time of patients with NSCLC with high (n = 565) and low (n = 579) MCM3AP-AS1 expression levels (Affy ID: 232740_at; the samples were divided into high and low expression groups according to the median value of MCM3AP-AS1 expression). (c) qRT-PCR was performed to detect MCM3AP-AS1 expressions in 63 cases of NSCLC tissues and adjacent tissues. (d) qRT-PCR was performed to detect miR-195-5p expressions in 63 cases of NSCLC tissues and adjacent tissues. (e) qRT-PCR was performed to detect E2F3 mRNA expressions in 63 cases of NSCLC tissues and adjacent tissues. (f–h) Pearson’s correlation analysis was performed to assess the correlations among MCM3AP-AS1, miR-195-5p and E2F3 mRNA in NSCLC tissues.
