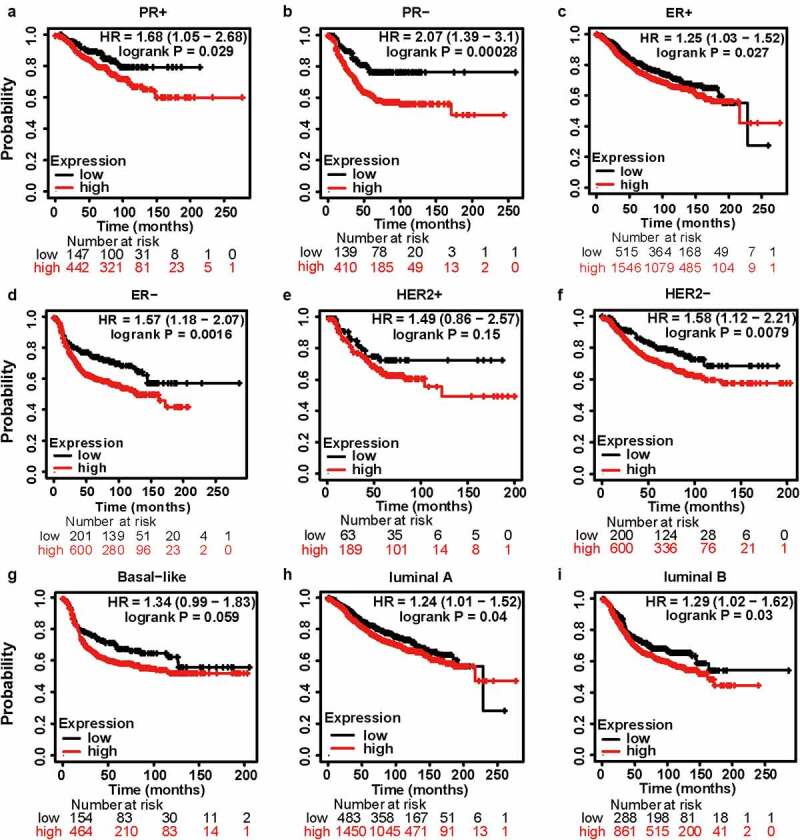
Figure 5.

The kaplan-meier survival curves of high and low MCT4 expression in BC through the kaplan-meier plotter database. the RFS in (a) PR+ BC, (b) PR- BC, (c) ER+ BC, (d) ER- BC, (e) HER2+ BC, (f) HER2- BC, (g) basal-like subtype, (h) luminal A subtype, (i) luminal B subtype. RFS: relapse-free survival; HR: hazard ratio
