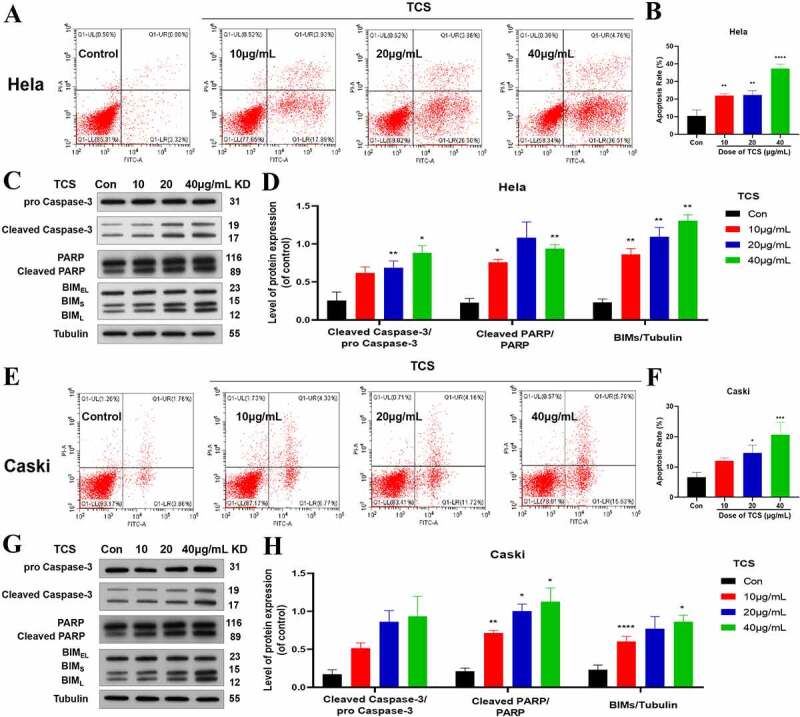
Figure 3.

TCS-induced apoptosis in HeLa & caski cells. (a-b) Flow cytometric analysis on the cell apoptosis rate in HeLa cells; (c-d) Western blotting for detecting cell apoptosis markers (Caspase-3, PARP, and BIMs) in HeLa cells; (e-f) Flow cytometric analysis on the cell apoptosis rate in caski cells; (g-h) Western blotting for detecting cell apoptosis markers (Caspase-3, PARP, and BIMs) in caski cells. Data were analyzed through one-way ANOVA along with expressed as mean ± SD. *p < 0.05, **p < 0.01, ****p < 0.0001, in comparison with control group. TCS, Trichosanthin
