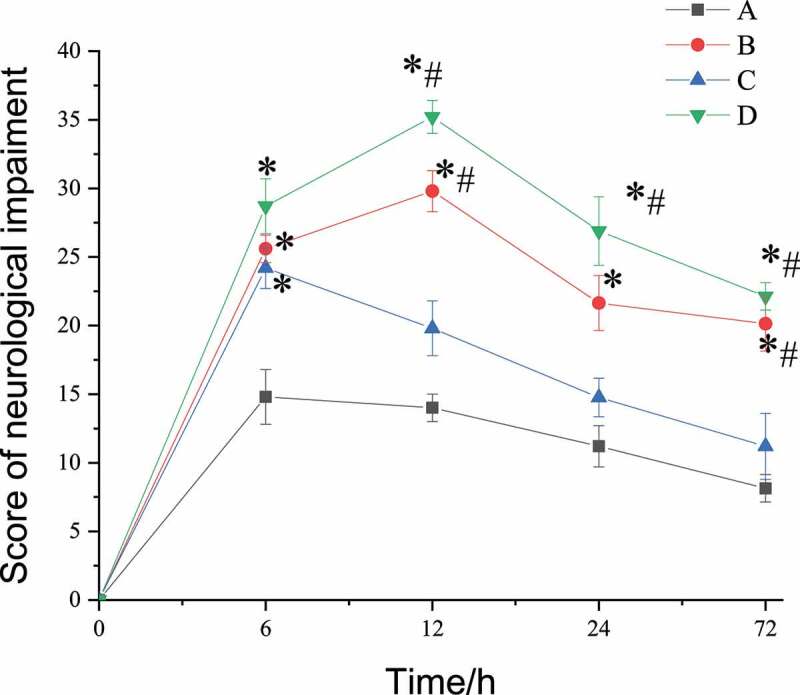
Figure 1.

Results of evaluation of neurologic impairment
(Note: *represented a significant difference from group A (control group), P < 0.05; # represented a significant difference from group A and group C at the same time, P < 0.05.)

Results of evaluation of neurologic impairment
(Note: *represented a significant difference from group A (control group), P < 0.05; # represented a significant difference from group A and group C at the same time, P < 0.05.)