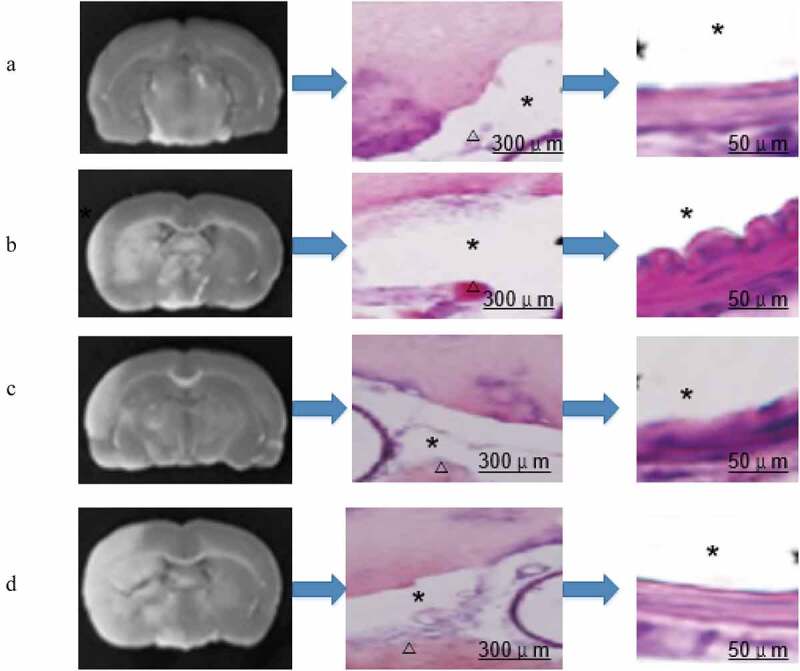
Figure 6.

Comparison of brain slices
(Note: * in the figure represented the arterial lumen; the triangles represented blood clots in the subarachnoid space; the middle column was the general image, and the last column was the partial enlarged image.)
