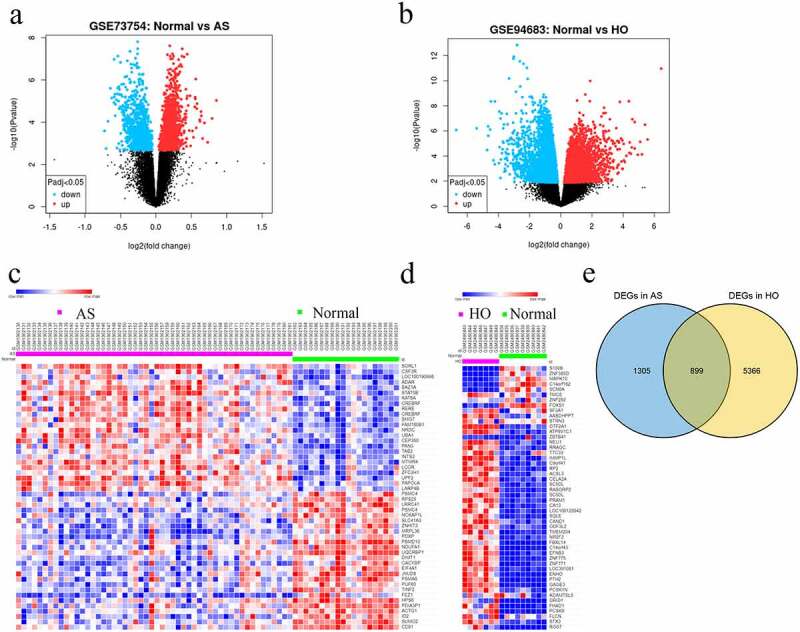
Figure 1.

A Volcano plots showing DEGs in GSE73754 and b GSE94683 microarray datasets. c Heatmaps and hierarchical clustering analysis of the top 50 DEGs in GSE73754 and d GSE94683. e Genes with adjusted P-value < 0.05 and |log2 fold change (FC)| > 0.2 are identified as DEGs. Red indicates up-regulation and blue indicates down-regulation. Venn diagram depicting 355 overlapping DEGs identified between GSE73754 and GSE94683 datasets
