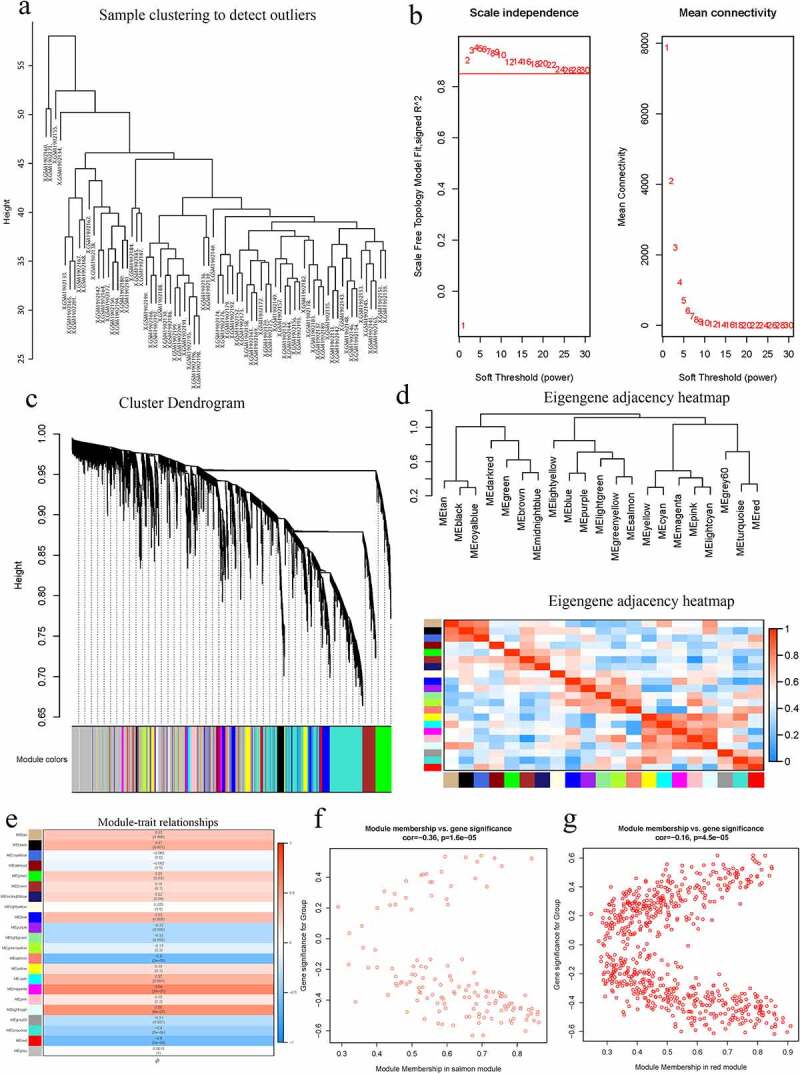
Figure 2.

A Hierarchical clustering of 52 AS and 20 healthy samples. b Analysis of network topology for various soft-thresholding powers. Left: The x-axis reflects the soft-thresholding power; the y-axis reflects the scale independent topology model fit index. Right: The x-axis reflects the soft-thresholding power; the y-axis reflects the mean connectivity (degree). c Clustering dendrogram of genes with dissimilarity based on topological overlap, together with assigned their module colors. d Eigengene dendrogram and eigengene adjacency plot. e Module trait association. Each row corresponds to a module; each cell contains the corresponding correlation and P-value. The table is color-coded by correlation. f Scatter diagrams depicting gene correlation of the module. Left: salmon module; Right: red module. Comparison between the red and the salmon module indicated salmon to be the key module correlated with AS (cor = −0.36)
