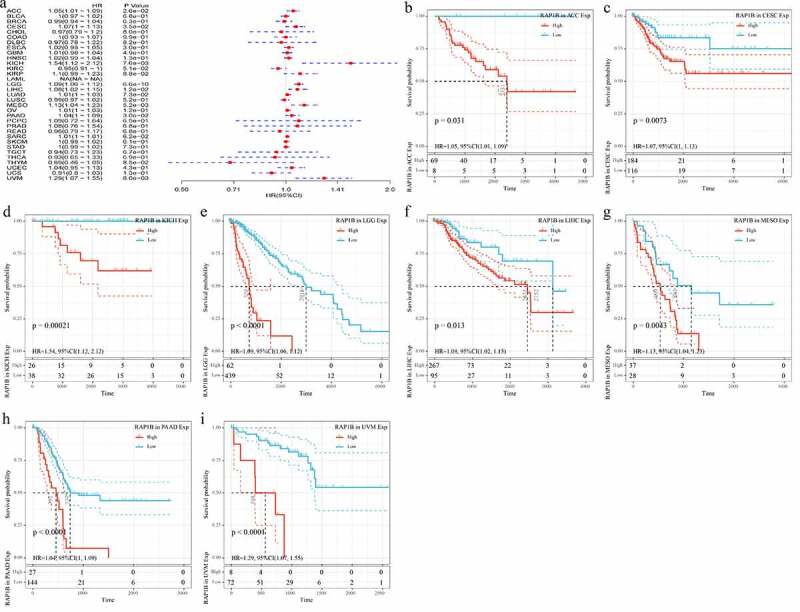
Figure 3.

Correlation of Rap1b expression with DSS from TCGA database. (a) Univariate Cox regression analysis and forest plot showed the hazard ratios related to Rap1b expression in pan-cancer. Red squares represent hazard ratio. Kaplan–Meier survival curves comparing the high and low expression of Rap1b in different types of cancer from TCGA database. DSS of ACC (b), CESC (c), KICH (d), LGG (e), LIHC (f), MESO (g), PAAD (h), UVM (i). P < 0.05 is considered to be significant, with a 95% confidence interval of the dotted line. DSS, disease-specific survival
