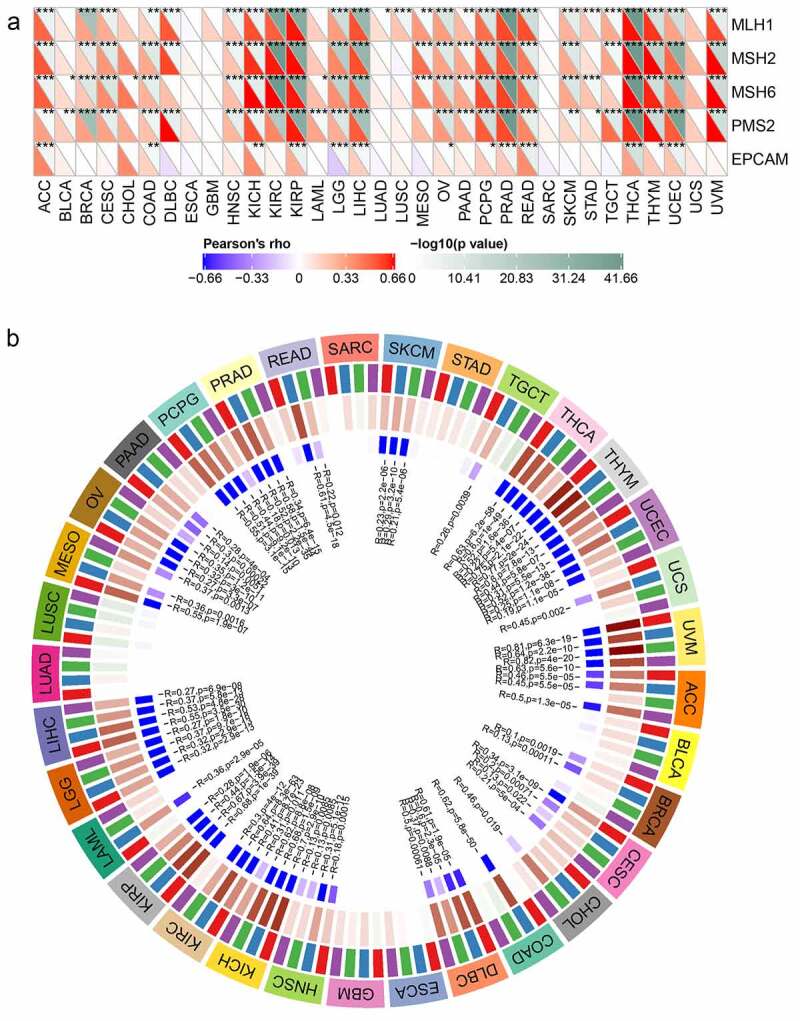
Figure 7.

Relationships between Rap1b, MMRs deficiency and DNA methylation level in different cancers. (a) The relationship between the Rap1b expression of five important MMR related genes (MLH1, MSH2, MSH6, PMS2, EPCAM). The lower triangle of each tile represents the coefficient calculated by Pearson correlation test, and the upper triangle represents the P-value after log10 transformation. *P < 0. 05, **P < 0. 01, ***P < 0.001. (b) The relationship between Rap1b and four methyltransferases (DNMT1: red, DNMT2: blue, DNMT3A: green, DNMT3b: purple)
