
Figure 1.
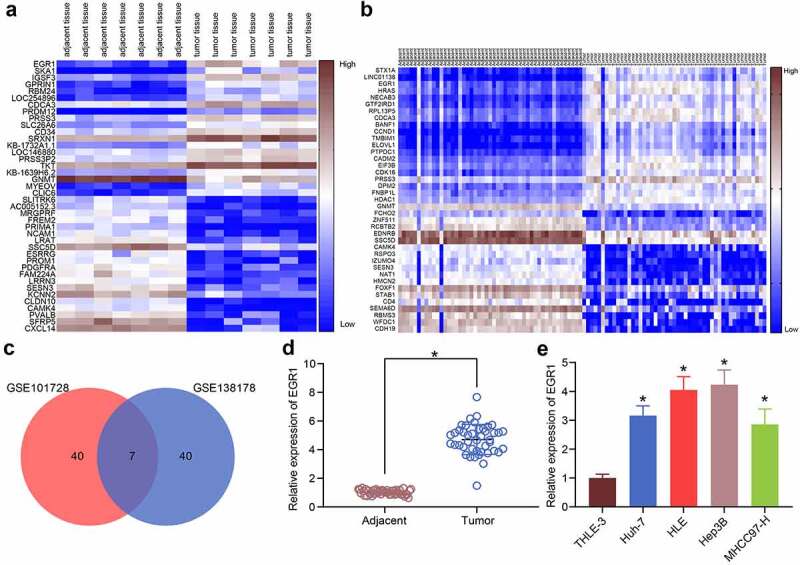
EGR1 is highly expressed in LC samples. a-b, heatmaps for DEGs between LC tissues and healthy tissues in the GEO GSE101728 (a) and GSE138178 (b) datasets; c, an intersection analysis based on the findings in a and b using a Venn diagram; d, expression of EGR1 mRNA in the clinical tumor tissues and the para-cancerous tissues examined by RT-qPCR (n = 43, the paired t test, *p < 0.05); e, expression of EGR1 mRNA in the acquired LC cell lines (Huh-7, HLE, Hep3B and MHCC97-H) and in THLE-3 cells evaluated by RT-qPCR (one-way ANOVA, *p < 0.05)