Figure 6.

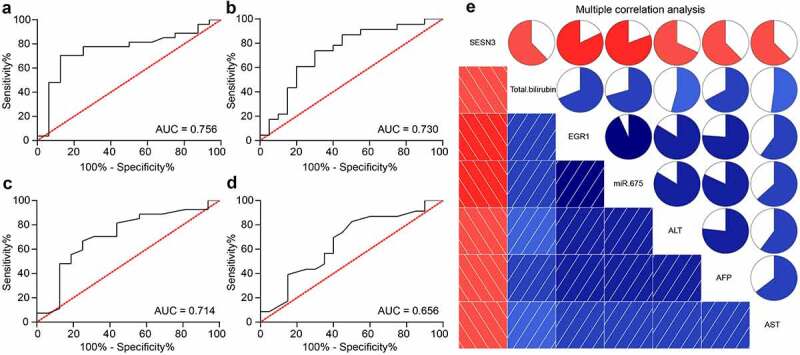
miR-675 and SESN3 are possible biomarkers of LC. a, predictive value of miR-675 in tumor size (a) and TNM staining (b) determined by ROCs (Wilson/Brown analysis, *p< 0.05); c-d, predictive value of SESN3 in tumor size (c) and TNM staining (d) determined by ROC (Wilson/Brown analysis, *p< 0.05); e, interactions among EGR1, miR-675 and SESN3 expression and the levels of TBIL, AST, ALT and AFP in serum of patients analyzed using a multivariate correlation analysis (Pearson’s analysis, *p< 0.05)
