
Figure 2.
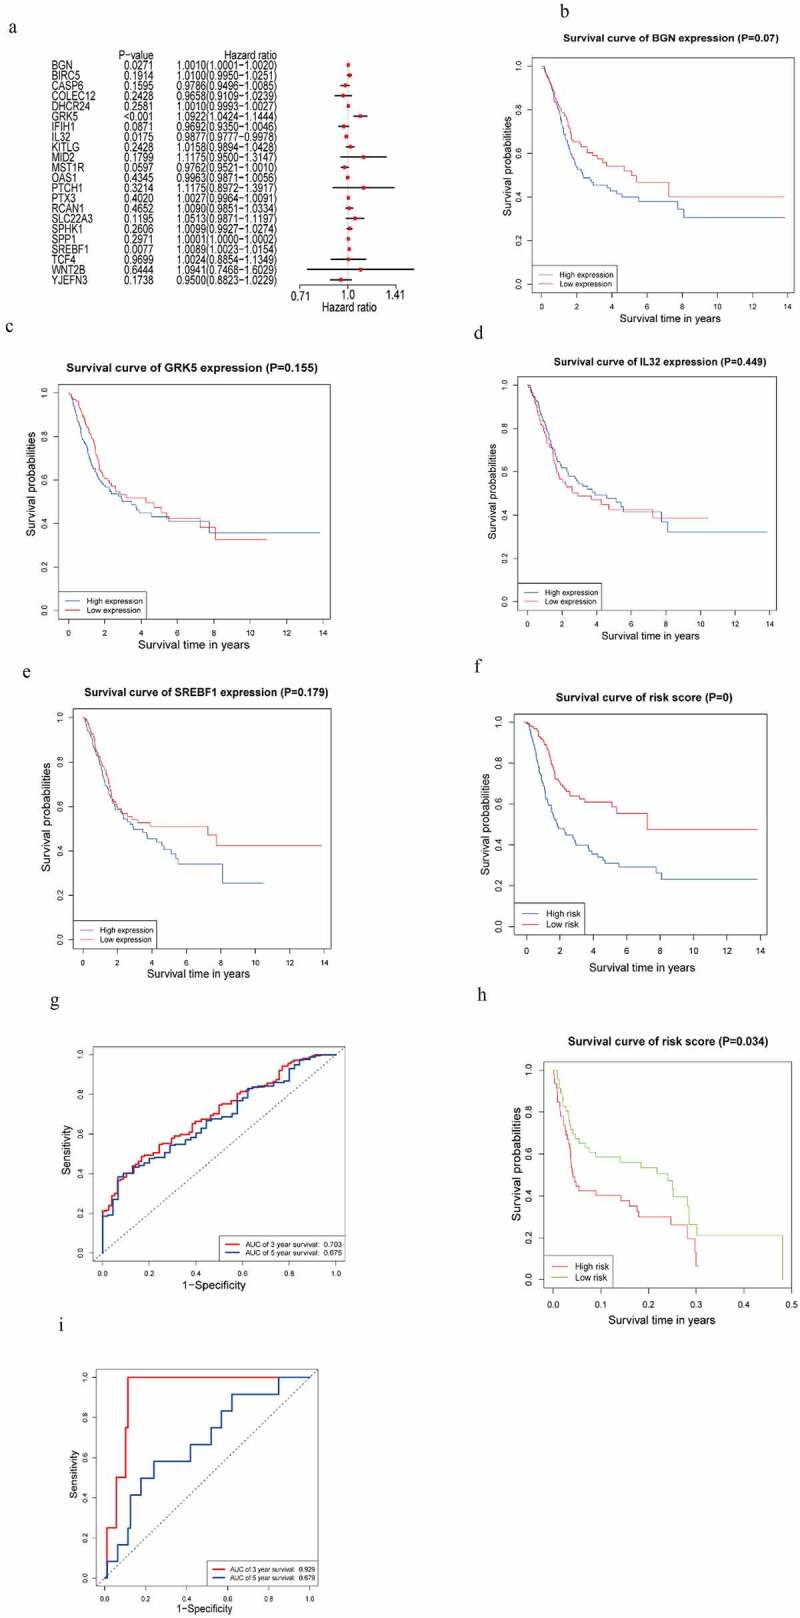
m6AIGs associated with prognosis and functional annotation. (a) Forest plot illustrated the result of multivariate Cox regression analysis for the 22 m6AIGs. (b–f) The survival analysis for the BGN, GRK5, IL32, SREBF1 and risk score level, respectively. (g) In TCGA cohort, ROC curve predicted the 3- and 5-year survival. (h) Risk score level model was developed within GEO cohort. (i) The area under ROC curve was calculated within GEO cohort