
Figure 5.
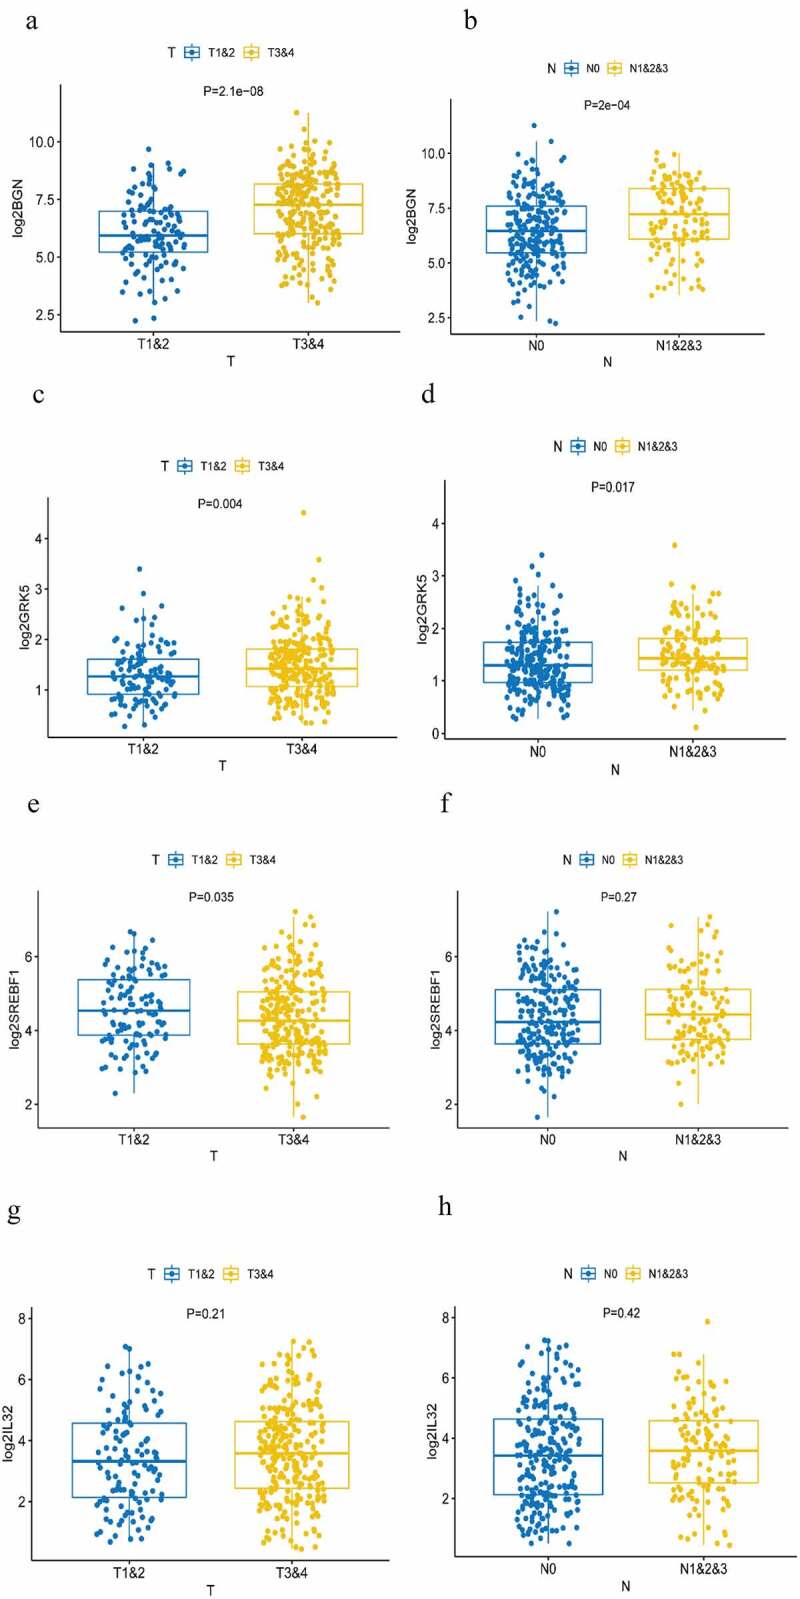
Analysis of TNM stage correlation . (a, b) The correlation of the expression of BGN with T and N staging. (c, d) The correlation of the expression of GRK5 with T and N staging. (e, f) The correlation of the expression of SREBF1 with T and N staging. (g, h) The correlation of the expression of IL32 with T and N staging